![]() Carley Garner
Carley Garner
DeCarley Trading
We monitor commodity market positioning and sentiment almost as much as we chart prices. We’ve witnessed an unusual conundrum; the spread between the market sentiment of industry insiders and the net long futures market position held in crude oil is unsustainably wide. Specifically, according to the Bullish Consensus Sentiment Index, about 70% of those polled are bullish crude oil. Nonetheless, the COT (Commitments of Traders) Report issued by the CFTC (Commodity Futures Trading Commission) suggests that a mere 250,000 net long contracts are currently being held. This is substantially below the half-a-million contracts held last year and, even more so, below the 750,000 all-time high net long position. If the so-called “smart money” decided to put their money where their mouths are, oil could see $92.00 per barrel, at minimum, and possibly even reach the low triple digits!
Seasonally, the oil market has a tendency to peak in mid-to-late October, so that leaves multiple weeks of seasonal support. Further, we are still burning off the fumes of the 2020 COVID stimulus and liquidity injection campaigns; higher fuel prices haven’t hurt the travel industry. I’ve been traveling for work and pleasure; I can attest flying in 2023 is not the same as in 2019. Lost luggage, delayed flights, canceled flights, and other inconveniences are expected obstacles, not outliers, yet there are butts in seats. In fact, TSA data reports record traffic!
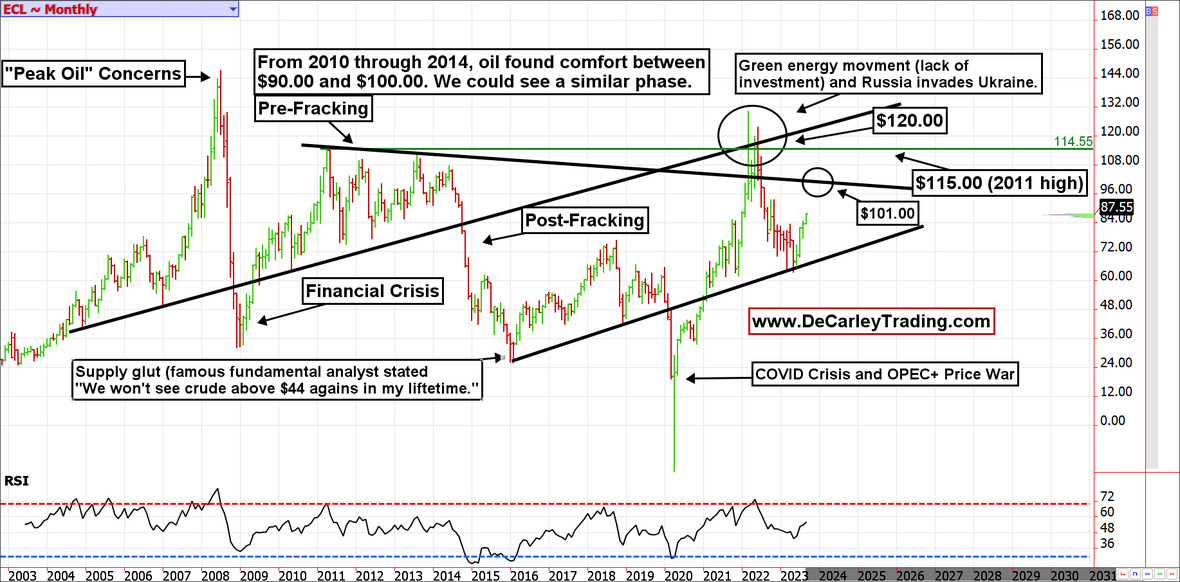
Monthly Crude Oil Futures
Revisiting the monthly oil chart, it is clear that prices held an uptrend line that dates back to the 2016 low (COVID shutdowns and an OPEC+ price war temporarily and violently breached this trendline). We see a similar downtrend line that dates back to 2010 (the Russian invasion of Ukraine temporarily and violently breached this trendline); this line comes in near $101.00 and will likely act as a price magnet. Confirming this idea is an RSI (Relative Strength Index) oscillator pointing higher with plenty of room to run before the market could be considered overbought.
Weekly Crude Oil Futures
Like the monthly chart, the weekly chart of oil futures suggests a move to $101.00 is in play. Weakness earlier this year found support near the 200-day moving average and pushed prices into what we believe is an equilibrium range between $75.00 and $101.00. According to our charts, this is the natural price range that likely would have existed if the black swan events from 2020 through 2022 were removed.
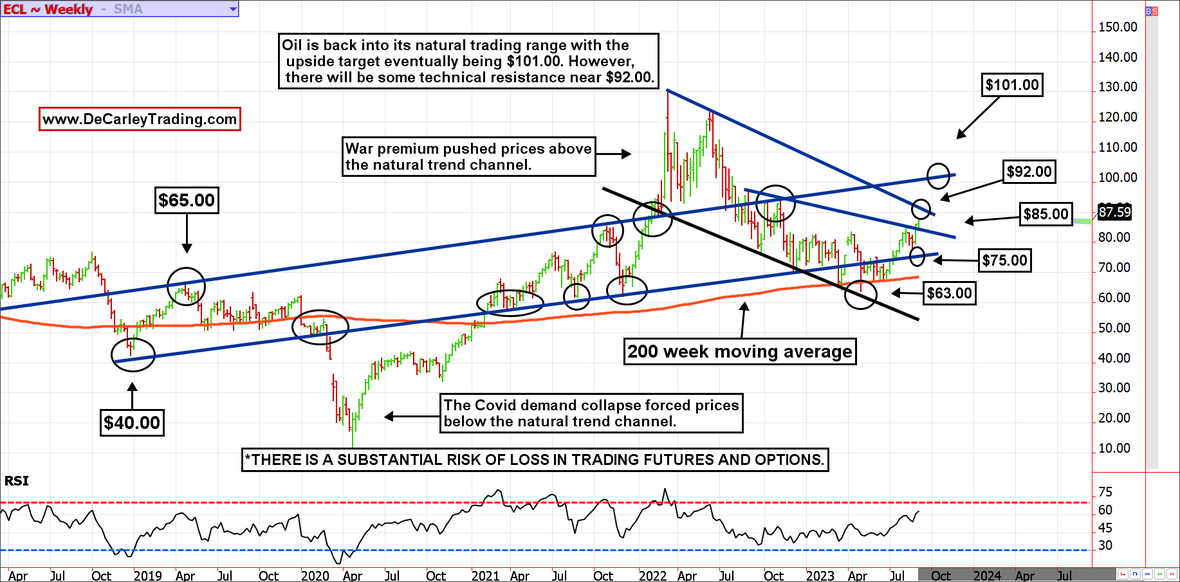
We suspect some rough waters near $92.00 based on a sharp downtrend line stemming from the 2022 top. Still, if the pessimism over China’s economic data dissipates and interest rates stabilize, triple-digit crude oil is likely (in our humble opinion).
Due to the volatile nature of the futures markets some information and charts in this report may not be timely. There is substantial risk of loss in trading futures and options. Past performance is not indicative of future results. The information and data in this report were obtained from sources considered reliable. Their accuracy or completeness is not guaranteed and the giving of the same is not to be deemed as an offer or solicitation on our part with respect to the sale or purchase of any securities or commodities. Any decision to purchase or sell as a result of the opinions expressed in this report will be the full responsibility of the person authorizing such transaction.
Recommended Content
Editors’ Picks
EUR/USD stabilizes near 1.0500, looks to post weekly losses

EUR/USD extended its daily decline toward 1.0500 in the second half of the American session, pressured by the souring market mood. Despite the bullish action seen earlier in the week, the pair remains on track to register weekly losses.
GBP/USD falls below 1.2150 as USD rebounds

Following an earlier recovery attempt, GBP/USD turned south and declined below 1.2100 in the second half of the day on Friday. The negative shift seen in risk mood amid rising geopolitical tensions helps the US Dollar outperform its rivals and hurts the pair.
Gold advances to fresh multi-week highs above $1,920

Gold extended its daily rally and climbed above $1,920 for the first time in over two weeks on Friday. Escalating geopolitical tensions ahead of the weekend weigh on T-bond yields and provide a boost to XAU/USD, which remains on track to gain nearly 5% this week.
Bitcoin could be an alternative to US-listed companies but not in the short term

Bitcoin has dipped below $27,000, adding to the subdued cryptocurrency market sentiment. While short-term price concerns persist, analysts predict a rebound based on historical figures.
Nvidia Stock Forecast: NVDA slips as Biden administration attempts to close AI chip loophole

Nvida's stock price opened marginally lower on Friday after Reuters reported that the Biden administration is attempting to close a loophole that allowed Chinese companies access to state-of-the-art computer chips used for AI.