![]() Harry S. Dent, MBA
Harry S. Dent, MBA
Dent Research
While Covid-19 continues its expansion into the U.S. and Europe, there are clear signs that its acceleration is slowing and that we could be seeing a marked slowdown between mid- and late April, like China did in mid-February.
They are going back to work and into the streets now.
With mind-blowing but totally predictable stimulus programs, you would think the markets would be high on crack again… but most signs point to one more surge downward – albeit not as violent or sharp as the last.
The Big Picture: We are in the late stages of that first average 42% crash in 2.6 months that marks the end of great bubbles that seem to have no end while they are going. There will be a substantial rebound – and maybe this time, more so – that by history should last three to five months and reclaim 50% to 60% of the losses…
Then, after the last denial – the last hope, the last “high” – comes the detox, the real deleveraging of debt and bubbles…
The Depression We Had to Have.
I was talking to my Australian promoter Greg Owen over the weekend about how to re-create my tours there online for now, and he said that in Australia’s only serious downturn in three decades, their most cherished prime minister infamously called it “the recession that we had to have.”
That’s the real big picture. We cannot get healthy again until we get the grand perversion of debt and financial asset bubbles out of our economy – as they both pervert the very miracle of free market capitalism and democracy that were born together as the great marriage of opposites in the late 1700s. Japan has proven more and longer than any country that three decades of stimulus and money printing without deleveraging and restructuring debts does not work! Where’s its recovery, its spring season?
From here on out, it will be an epic battle between escalating money printing and fiscal stimulus versus unprecedented debt and financial asset bubbles unwinding to offset. There’s $330 trillion of financial asset bubbles including loans, so guess which will win!
This quick crash in stocks alone has already destroyed over $15 trillion in wealth in about one month. There will be more like $160 trillion, two times global GDP, and $60 trillion in the asset-rich U.S., three times GDP before this detox is over.
So, you think they can get away with printing $160 trillion before looking beyond ridiculous and losing all credibility? Take that, you academic, douchebag economists who have never run a business… or had sex (apparently)!
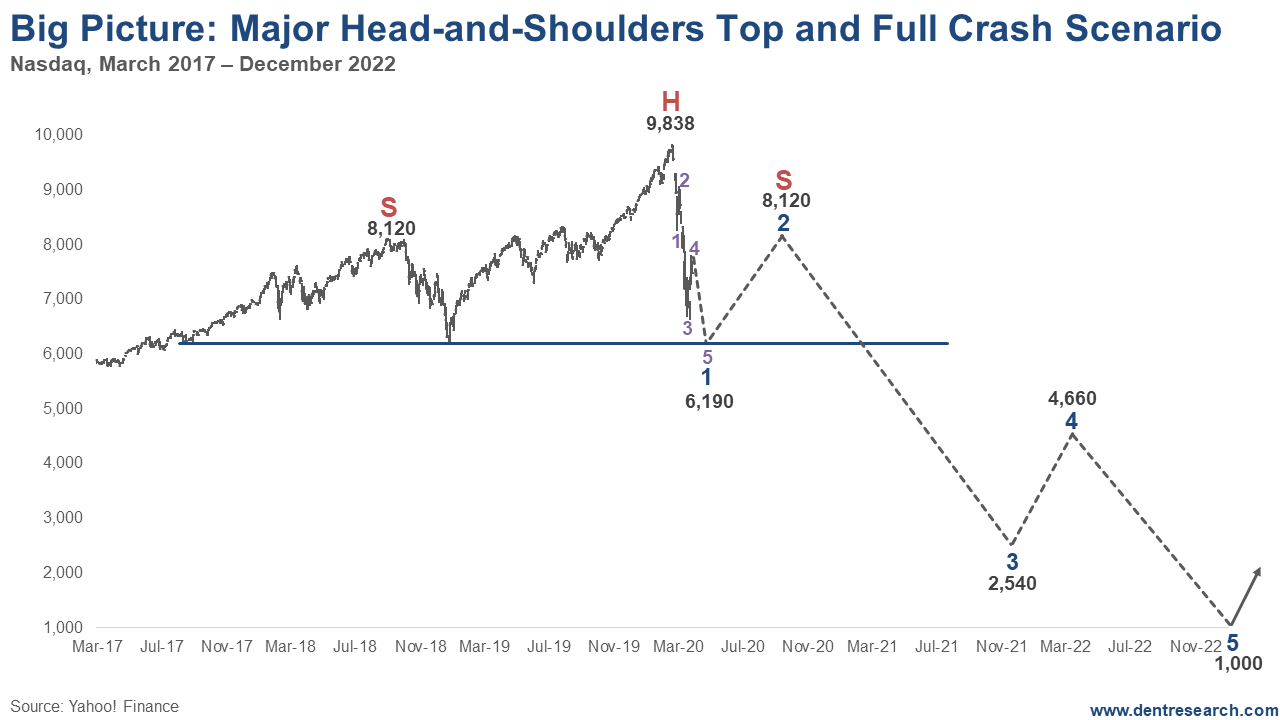
Here’s my best depiction of how this will play out using one of my two favorite chart patterns at major topping periods (the other is the megaphone pattern, which is also in play on a larger and smaller scale). This is a large head-and-shoulders pattern for the Nasdaq that appears to be forming. And even if it doesn’t, this is the pattern history clearly tells me will occur.
There is the biggest delusion currently, that this crash is all about the coronavirus, a black swan. This is a true black swan, but really it’s the Perfect Shock! Ever more stimulus can further cushion an already massively over-stimulated economy, but it can’t stop the virus like it can temporarily stop stock crashes and bank failures, etc.
My best target for the final wave of this first crash is 2,080 on the S&P 500 and 6,190 (the December 2018 low) on the Nasdaq. That forms a flat neckline through that late 2018 low. The left shoulder peaked at the September 2018 top around 8,120. The rebound I am forecasting from a lower low just ahead would peak between around July, and at the latest the election again, at around 8,120 – I am assuming mid-September 2020. (Note: I am using classic head-and-shoulder and wave ratios to make my best guess for this larger scenario, but no way will it work out exactly like this.)
The biggest third wave then comes from later this year into round the end of 2021. That wave (like the recent third wave down) should be the largest and longest. It would bottom according to the head-and-shoulder projections around 2,540 in December 2021 – the worst year of the larger crash. (The distance from the head to the neckline equals the distance to the crash bottom form the neckline once its broken.) After a fourth wave bounce into around May 2022, the final bottom comes between 800 and 1,100 – or about 1,000 at the end of 2022… Then the crash of a lifetime is over and the opportunities truly begin!
But the stimulus will not last as exposures in the foundation continue to crack, businesses keep failing and some just don’t come back (I saw that here in Puerto Rico after the hurricane). Consumers default on loans and some just give up on getting work again or get worse jobs. Major corporations, here and in the emerging world default and many can’t get healthy again. Emerging country governments keep defaulting.
This isn’t primarily about the virus, as will become clear when the virus proves to be temporary and the downturn does not. You will soon have a chance to leverage this rebound and prepare even better next time to profit from safe haven investments and to make a small fortune in targeted downside plays. But again, the big profit comes simply from buying the best financial assets and companies and real estate on the biggest sale since 1932-33.
Just after the election, if not before, the economy just rolls back over and central banks have already blown almost all of their ammunition right off the start this time – as they know how weak the economy has been after giving it non-stop life support for 11 years.
Then we get the classic 2-year+ more precipitous decline in stocks and the economy melts down like late 2000 into late 2002, and early 1930 into mid-1932. Then, and only then is it over, and finally the detox can happen and it will be unbelievably painful… except we have prepared you for that and it can be unbelievably profitable – what I have called:
The Opportunity of a Lifetime to Create Extreme Wealth.
Do not miss my once-a-month “Conquer the Crash” video, in subscribers’ inboxes tomorrow, where I will summarize all of the short-term analysis over the last few weeks of the fastest major stock crash ever and the final rebound before its curtains.
I won’t be able to get deeper into this important level of analysis for a while.
The content of our articles is based on what we’ve learned as financial journalists. We do not offer personalized investment advice: you should not base investment decisions solely on what you read here. It’s your money and your responsibility. Our track record is based on hypothetical results and may not reflect the same results as actual trades. Likewise, past performance is no guarantee of future returns. Certain investments such as futures, options, and currency trading carry large potential rewards but also large potential risk. Don’t trade in these markets with money you can’t afford to lose. Delray Publishing LLC expressly forbids its writers from having a financial interest in their own securities or commodities recommendations to readers.
Recommended Content
Editors’ Picks

EUR/USD stays defensive below 1.0500 amid light trading
EUR/USD struggles to capitalize on recent upside and oscillates in a narrow range below 1.0500 in European trading on Monday. However, the pair's downside remains cushioned by persistent US Dollar weakness and an upbeat mood. Focus shifts to central bank talks.

GBP/USD ranges near 1.2600 as US Dollar steadies
GBP/USD keeps its range near 1.2600 in the early European session on Monday. The pair stays support amid a subdued US Dollar price action following Friday's disappoining US Retail Sales data. Thin trading is likely to extend as US markets are closed in observance of Presidents' Day.

Gold: Bulls have the upper hand near $2,900 amid trade war fears and weaker USD
Gold regained positive traction on Monday amid sustained USD weakness. Concerns about Trump’s tariffs further benefit the safe-haven XAU/USD pair. The fundamental and technical setup underpin prospects for additional gains.

Five fundamentals for the week: Peace talks, Fed minutes and German election stand out Premium
US President Donald Trump remains prominent, especially in a week when high-level peace talks kick off. Nevertheless, the Commander-in-Chief competes with the world's most powerful central bank, and other events are of interest as well.

Tariffs likely to impart a modest stagflationary hit to the economy this year
The economic policies of the Trump administration are starting to take shape. President Trump has already announced the imposition of tariffs on some of America's trading partners, and we assume there will be more levies, which will be matched by foreign retaliation, in the coming quarters.

The Best Brokers of the Year
SPONSORED Explore top-quality choices worldwide and locally. Compare key features like spreads, leverage, and platforms. Find the right broker for your needs, whether trading CFDs, Forex pairs like EUR/USD, or commodities like Gold.