![]() Littlefish FX Analysts
Littlefish FX Analysts
Littlefish FX
It’s time to take a look at Bollinger bands. And no, unfortunately, it’s nothing to do with champagne.
Bollinger bands are a technical analysis tool invented by John Bollinger. (Who also wrote the imaginatively titled book Bollinger on Bollinger Bands). Basically, they work by measuring the “highness” or “lowness” of a price, compared to previous trades.
They’re made up of a moving average with upper and lower bands based on standard deviations.
FOR EXAMPLE…
A common setting for a Bollinger band is a 20 period moving average with the upper and lower bands set at 2 standard deviations.
Why Use Standard Deviations?
Standard deviations can be used to gives you an idea of how much the price you are looking at varies from the average over a period of time.
In a totally random set of results, you would expect to see 95% of all results falling within 2 standard deviations, and more than 99% to be within 3. So applying this to trading, IF price is completely random, then there’s a very good chance that the next price the market makes will fall somewhere between the upper and lower Bollinger bands.
Of course, this all depends on price being random, and whether this is true or not is an argument for another day. However, even if price is not random, Bollinger bands are still useful to provide an indication of how far price is likely to move in a certain period.
How To Make Bollinger Bands Work For You
Bollinger bands can be applied to both trending and non-trending markets using a slightly different strategy for each environment. Let’s take a look at both, and the best ways to analyse them…
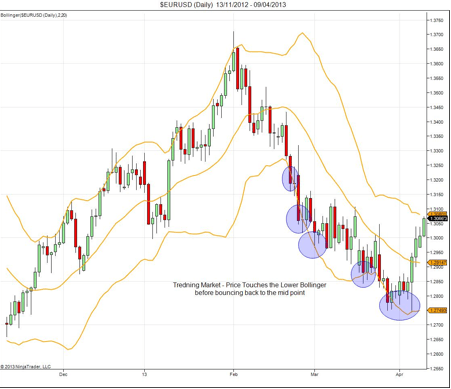
1. Trending Markets
In a trending market, price will be pushing in a particular direction, pushing on either the upper or lower Bollinger band, depending what direction it’s moving in.
This is shown in the chart below:
HOW TO DO IT:
In a trending market, the best way to use Bollinger bands is through the pull back strategy.
Bollinger bands can allow you to use a pull back towards the moving average to enter into the direction of the trend.
WHY IT’S USEFUL:
Using Bollinger bands in this way allows you to run tight stops, in order to capture the trend.
DON’T FORGET:
This works particularly well on lower time frames. When used with good risk/reward management, it can be a really good strategy for use on highly traded pairs (like the EURUSD).
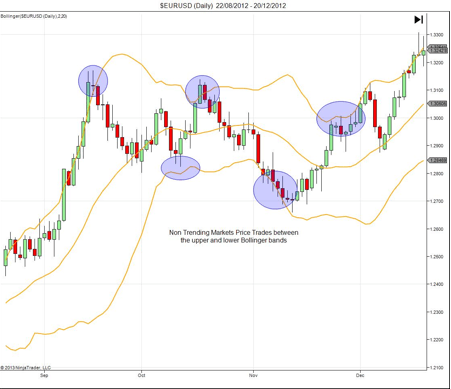
2. Non-Trending Markets
In a non-trending market (also known as range bound or choppy), Bollinger bands can act as barriers to price, as shown in the chart:
HOW TO DO IT:
In a range bound or low volatility environments, you need to use Bollinger bands as a guide to how the price may move. You can do this using the fading strategy.
To do this, you need to look for an extreme price movement in low volatility, and then take the opposite position. Then, plot the 20 period moving average, and the 2 and 3 standard deviations on the chart, as shown below:
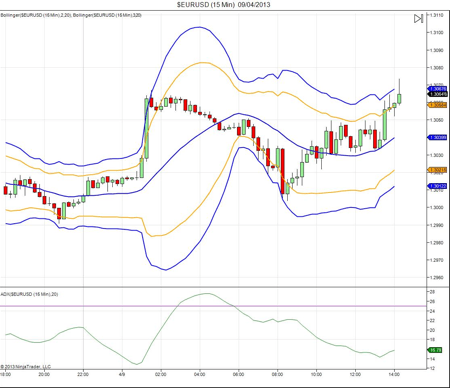
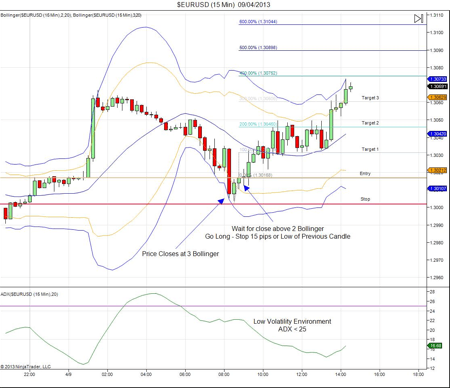
The final step is to look for the price to hit the outer Bollinger, then move back into the Bollinger range. It if breaks or closes above the inner Bollinger, you can then get in the direction towards the moving average.
Here’s an example of what might happen:
WHY IT’S USEFUL:
This strategy allows you to use relatively tights stops on lower time frames to capture a fade in the opposite direction.
DON’T FORGET:
To make sure you’re in a low volatility environment before using this strategy. (You can do this using ADX or an Awsome Oscilator, or get clues from your moving averages or MACD).
All comments, charts and analysis on this website are purely provided to demonstrate our own personal thoughts and views of the market and should in no way be treated as recommendations or advice. Please do not trade based solely on any information provided within this site, always do your own analysis.
Editors’ Picks

EUR/USD struggles to build on previous week's gains, stays below 1.0500
EUR/USD stays under modest bearish pressure and trades below 1.0500 on Monday. The cautious market mood supports the US Dollar and limits the pair's upside, while trading action remains subdued, with US markets remaining closed on Presidents' Day.

GBP/USD ranges near 1.2600 as US Dollar steadies
GBP/USD fluctuates in a tight channel near 1.2600 in the second half of the day on Monday. Trading volumes are likely to remain thin as financial markets in the US enjoy a log weekend in observance of the Presidents' Day holiday.

USD/JPY off lows but heavy near 151.50 amid upbeat Japan's Q4 GDP
The Japanese Yen sticks to its strong intraday gains in the wake of a strong domestic Gross Domestic Product print, which reaffirmed bets that the Bank of Japan will hike interest rates further.
Editors’ Picks
EUR/USD struggles to build on previous week's gains, stays below 1.0500
EUR/USD stays under modest bearish pressure and trades below 1.0500 on Monday. The cautious market mood supports the US Dollar and limits the pair's upside, while trading action remains subdued, with US markets remaining closed on Presidents' Day.
GBP/USD ranges near 1.2600 as US Dollar steadies
GBP/USD fluctuates in a tight channel near 1.2600 in the second half of the day on Monday. Trading volumes are likely to remain thin as financial markets in the US enjoy a log weekend in observance of the Presidents' Day holiday.

Gold clings to modest daily gains near $2,900
Gold regains its traction and trades in positive territory near $2,900 following Friday's sharp decline. Although financial markets in the US remain closed on Monday, investors will scrutinize political headlines and comments from Fed officials.

Five fundamentals for the week: Peace talks, Fed minutes and German election stand out Premium
US President Donald Trump remains prominent, especially in a week when high-level peace talks kick off. Nevertheless, the Commander-in-Chief competes with the world's most powerful central bank, and other events are of interest as well.

Bitcoin Price Forecast: BTC stalemate soon coming to an end
Bitcoin price has been consolidating between $94,000 and $100,000 for almost two weeks. Amid this consolidation, investor sentiment remains indecisive, with US spot ETFs recording a $580.2 million net outflow last week, signaling institutional demand weakness.
RECOMMENDED LESSONS
Making money in forex is easy if you know how the bankers trade!
Discover how to make money in forex is easy if you know how the bankers trade!
5 Forex News Events You Need To Know
In the fast moving world of currency markets, it is extremely important for new traders to know the list of important forex news...
Top 10 Chart Patterns Every Trader Should Know
Chart patterns are one of the most effective trading tools for a trader. They are pure price-action, and form on the basis of underlying buying and...
7 Ways to Avoid Forex Scams
The forex industry is recently seeing more and more scams. Here are 7 ways to avoid losing your money in such scams: Forex scams are becoming frequent. Michael Greenberg reports on luxurious expenses, including a submarine bought from the money taken from forex traders. Here’s another report of a forex fraud. So, how can we avoid falling in such forex scams?
What Are the 10 Fatal Mistakes Traders Make
Trading is exciting. Trading is hard. Trading is extremely hard. Some say that it takes more than 10,000 hours to master. Others believe that trading is the way to quick riches. They might be both wrong. What is important to know that no matter how experienced you are, mistakes will be part of the trading process.

The Best Brokers of the Year
SPONSORED Explore top-quality choices worldwide and locally. Compare key features like spreads, leverage, and platforms. Find the right broker for your needs, whether trading CFDs, Forex pairs like EUR/USD, or commodities like Gold.