![]() Brandon Wendell, CMT
Brandon Wendell, CMT
Brandon Wendell
Two questions I always receive when people find out that I trade for a living are: Where do you see the markets going? and, Are there any sure fire shortcuts to making money?Are there any sure fire shortcuts to making money? The first question is easy to answer by viewing the charts of the securities you want to trade. The second question doesn’t have an answer because there is no magic formula that exists. To become successful in the markets, you need the right education, a mentor and the willingness to put in the time to build your skills.
Utilizing the chart reading skill set I acquired through my own educational path as a student at Online Trading Academy, I do see the potential for a sharp market downturn beginning now. The following weekly chart of the S&P 500 stock index shows that prices are dropping from the second touch of a supply zone.
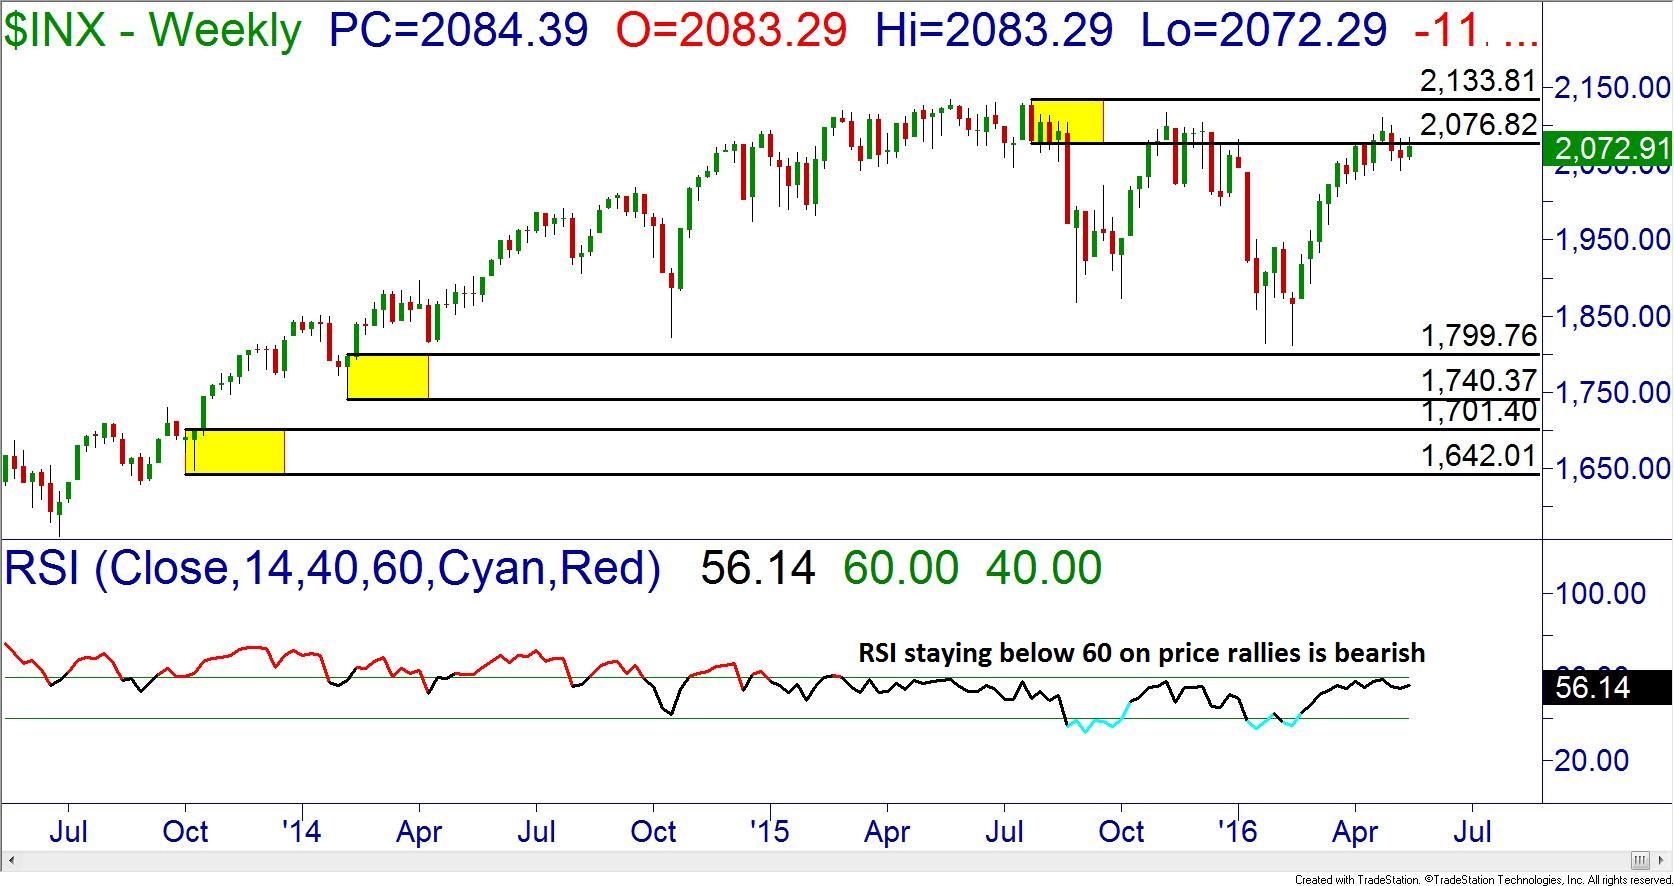
The trend never gained enough strength in April to take out the highs that we formed in late 2015, nor did it cause the RSI indicator to break 60. In previous articles, I have discussed the use of the RSI for trend indication.
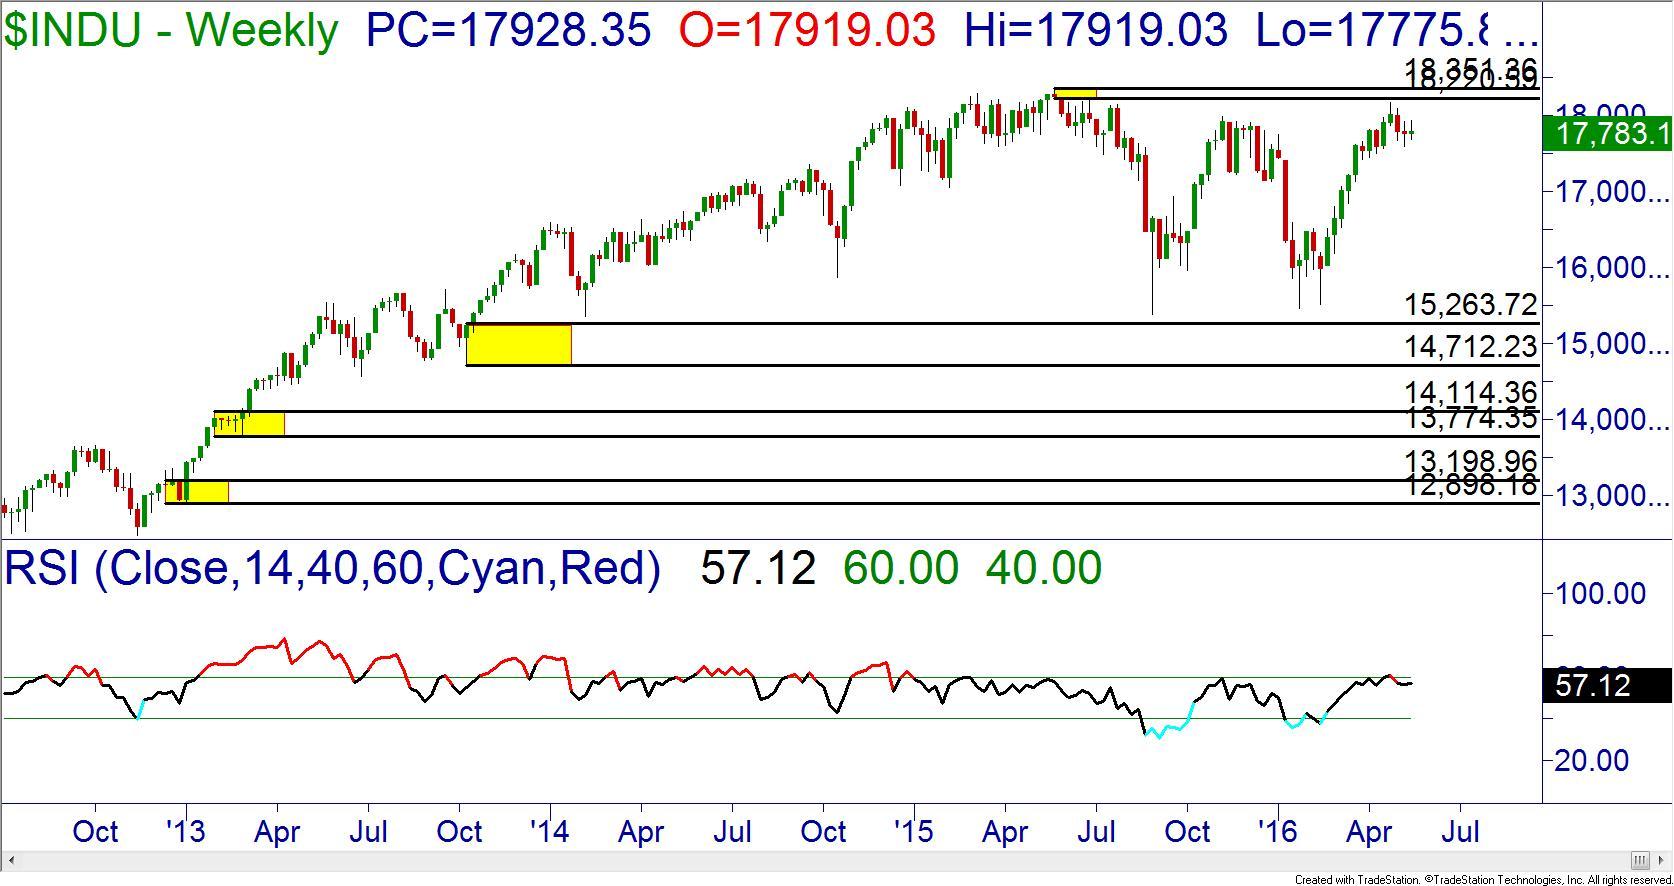
Even though major news outlets were celebrating the Dow Index making new 2016 highs, they neglected to mention the supply zone near 18220 from early 2015. Prices were so weak that they actually failed to even reach the zone before being dragged down by the other indexes.
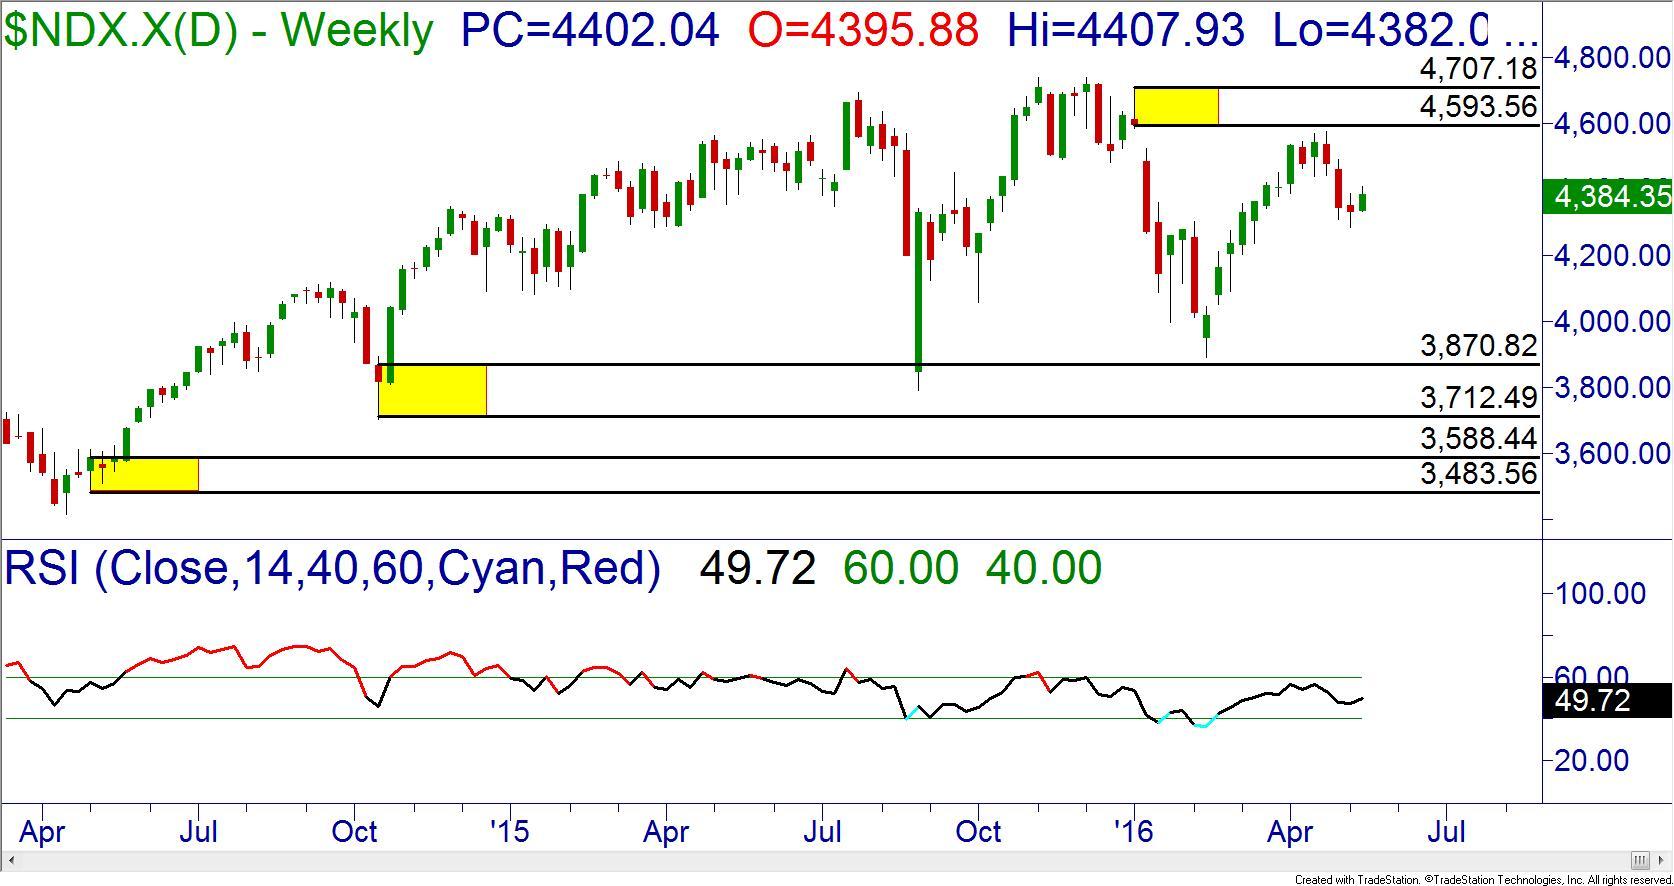
The Nasdaq 100 Index had been an incredibly strong index for some time, but it also failed shy of its supply zone on the weekly charts before dropping in price. The failure of the RSI to pierce 60 additionally suggests the continuation of the downtrend. The seasonal pattern of the tech heavy index is to, “Sell in May and go away.” With the calendar entering the traditional slow/bearish season for the Nasdaq, I would expect more price drops than rallies.
The mention of the seasonal pattern raises an interesting point. Most traders look myopically at the security they wish to trade. They ignore the outside influences that can affect their trades such as seasonal patterns and related securities that can increase your odds for success.
There are seasons for all securities:
-
Spring – Prices are starting their bullish rise.
-
Summer – The bull market and then the start of a slowdown and sideways consolidation
-
Autumn – Prices begin to fall
-
Wnter – The full bear market before the slowing and sideways consolidation
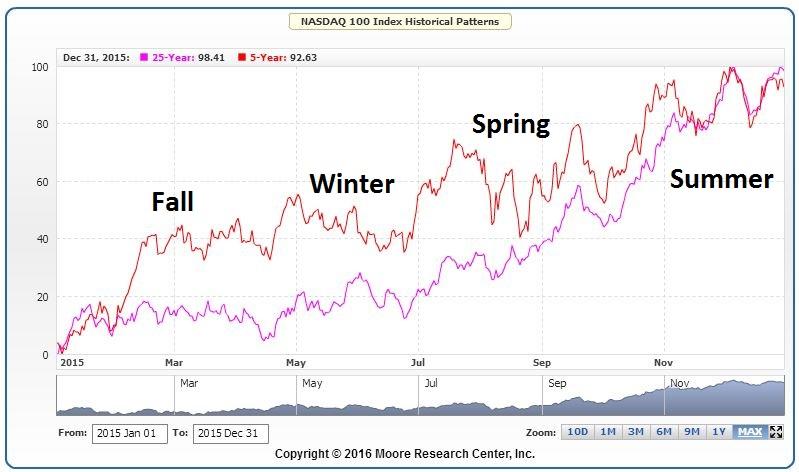
The chart above shows the seasonal pattern for the Nasdaq 100 index. The pink line is the averages of the index prices over the last 25 years while the red line shows it for the past five years. They are very similar but looking at the short term versus long can tell you if the pattern has been disrupted recently. The seasonal names, (spring, summer, autumn, winter), do not correlate to the calendar seasons. The spring for oil prices occurs in a different month than spring for the S&P 500. Oil will see prices rise when demand is strongest and drop when it is weakest.
The advantage of knowing seasonal patterns of the markets and securities we trade offers the longer term traders and investors a distinct advantage. When our weekly or monthly charts are approaching a supply or demand zone at the same time the season for that security is changing, we can increase our odds for successfully identifying the trend change. For example, if the season is contrary to the zones (approaching a supply zone in the spring season) we may break the zone instead of reversing.
The drawback to using seasonality is that there is a cost to obtain the information. Several services offer charts to identify the seasonal patterns for indexes and commodities for a fee. But if you can use this data to increase your profitability in the markets, it can be well worth it.
The seasonality should only be used to compliment Online Trading Academy’s core strategy. Trying to invest solely on seasonality could lead to losses. You improve your seasonal success by combining this analysis to what you already do on your long term charts. To learn what analysis is required, enroll in a course at your local center today.
Neither Freedom Management Partners nor any of its personnel are registered broker-dealers or investment advisers. I will mention that I consider certain securities or positions to be good candidates for the types of strategies we are discussing or illustrating. Because I consider the securities or positions appropriate to the discussion or for illustration purposes does not mean that I am telling you to trade the strategies or securities. Keep in mind that we are not providing you with recommendations or personalized advice about your trading activities. The information we are providing is not tailored to any individual. Any mention of a particular security is not a recommendation to buy, sell, or hold that or any other security or a suggestion that it is suitable for any specific person. Keep in mind that all trading involves a risk of loss, and this will always be the situation, regardless of whether we are discussing strategies that are intended to limit risk. Also, Freedom Management Partners’ personnel are not subject to trading restrictions. I and others at Freedom Management Partners could have a position in a security or initiate a position in a security at any time.
Editors’ Picks

EUR/USD stays defensive below 1.0500 amid light trading
EUR/USD struggles to capitalize on recent upside and oscillates in a narrow range below 1.0500 in European trading on Monday. However, the pair's downside remains cushioned by persistent US Dollar weakness and an upbeat mood. Focus shifts to central bank talks.

GBP/USD ranges near 1.2600 as US Dollar steadies
GBP/USD keeps its range near 1.2600 in the early European session on Monday. The pair stays support amid a subdued US Dollar price action following Friday's disappoining US Retail Sales data. Thin trading is likely to extend as US markets are closed in observance of Presidents' Day.

USD/JPY off lows but heavy near 151.50 amid upbeat Japan's Q4 GDP
The Japanese Yen sticks to its strong intraday gains in the wake of a strong domestic Gross Domestic Product print, which reaffirmed bets that the Bank of Japan will hike interest rates further.
Editors’ Picks
EUR/USD stays defensive below 1.0500 amid light trading
EUR/USD struggles to capitalize on recent upside and oscillates in a narrow range below 1.0500 in European trading on Monday. However, the pair's downside remains cushioned by persistent US Dollar weakness and an upbeat mood. Focus shifts to central bank talks.
GBP/USD ranges near 1.2600 as US Dollar steadies
GBP/USD keeps its range near 1.2600 in the early European session on Monday. The pair stays support amid a subdued US Dollar price action following Friday's disappoining US Retail Sales data. Thin trading is likely to extend as US markets are closed in observance of Presidents' Day.

Gold: Bulls have the upper hand near $2,900 amid trade war fears and weaker USD
Gold regained positive traction on Monday amid sustained USD weakness. Concerns about Trump’s tariffs further benefit the safe-haven XAU/USD pair. The fundamental and technical setup underpin prospects for additional gains.

Five fundamentals for the week: Peace talks, Fed minutes and German election stand out Premium
US President Donald Trump remains prominent, especially in a week when high-level peace talks kick off. Nevertheless, the Commander-in-Chief competes with the world's most powerful central bank, and other events are of interest as well.

Tariffs likely to impart a modest stagflationary hit to the economy this year
The economic policies of the Trump administration are starting to take shape. President Trump has already announced the imposition of tariffs on some of America's trading partners, and we assume there will be more levies, which will be matched by foreign retaliation, in the coming quarters.
RECOMMENDED LESSONS
Making money in forex is easy if you know how the bankers trade!
Discover how to make money in forex is easy if you know how the bankers trade!
5 Forex News Events You Need To Know
In the fast moving world of currency markets, it is extremely important for new traders to know the list of important forex news...
Top 10 Chart Patterns Every Trader Should Know
Chart patterns are one of the most effective trading tools for a trader. They are pure price-action, and form on the basis of underlying buying and...
7 Ways to Avoid Forex Scams
The forex industry is recently seeing more and more scams. Here are 7 ways to avoid losing your money in such scams: Forex scams are becoming frequent. Michael Greenberg reports on luxurious expenses, including a submarine bought from the money taken from forex traders. Here’s another report of a forex fraud. So, how can we avoid falling in such forex scams?
What Are the 10 Fatal Mistakes Traders Make
Trading is exciting. Trading is hard. Trading is extremely hard. Some say that it takes more than 10,000 hours to master. Others believe that trading is the way to quick riches. They might be both wrong. What is important to know that no matter how experienced you are, mistakes will be part of the trading process.

The Best Brokers of the Year
SPONSORED Explore top-quality choices worldwide and locally. Compare key features like spreads, leverage, and platforms. Find the right broker for your needs, whether trading CFDs, Forex pairs like EUR/USD, or commodities like Gold.