![]() Rick Wright
Rick Wright
Online Trading Academy
Hello traders! I’ve just come from our beautiful Woodland Hills, California office, and one of our veteran students asked me a question about Japanese candlesticks, specifically referring to an article I wrote a couple of years ago. With his questions in mind, I’d like to expand on how I use weekly candles to give me a bias for the following week. Let’s go!
Now that you have read that previous article, let’s talk about what to do if we aren’t already in a trade on the currency pair in question. In the following AUDUSD pair of charts, let’s say you find yourself looking at the pair around the time frame marked 1. Obviously, the pair has already had a large move to the down side, so you aren’t still looking for shorts way down here are you? You especially shouldn’t be with the big round number of .7500 hanging out down here (a psychological level of support/resistance.) Instead, when the first green bodied candle in this new uptrend decisively breaks past the previous week’s high price, you decide to look for long trades. That previous week’s high was formed on 12/05, and didn’t break until 12/14.
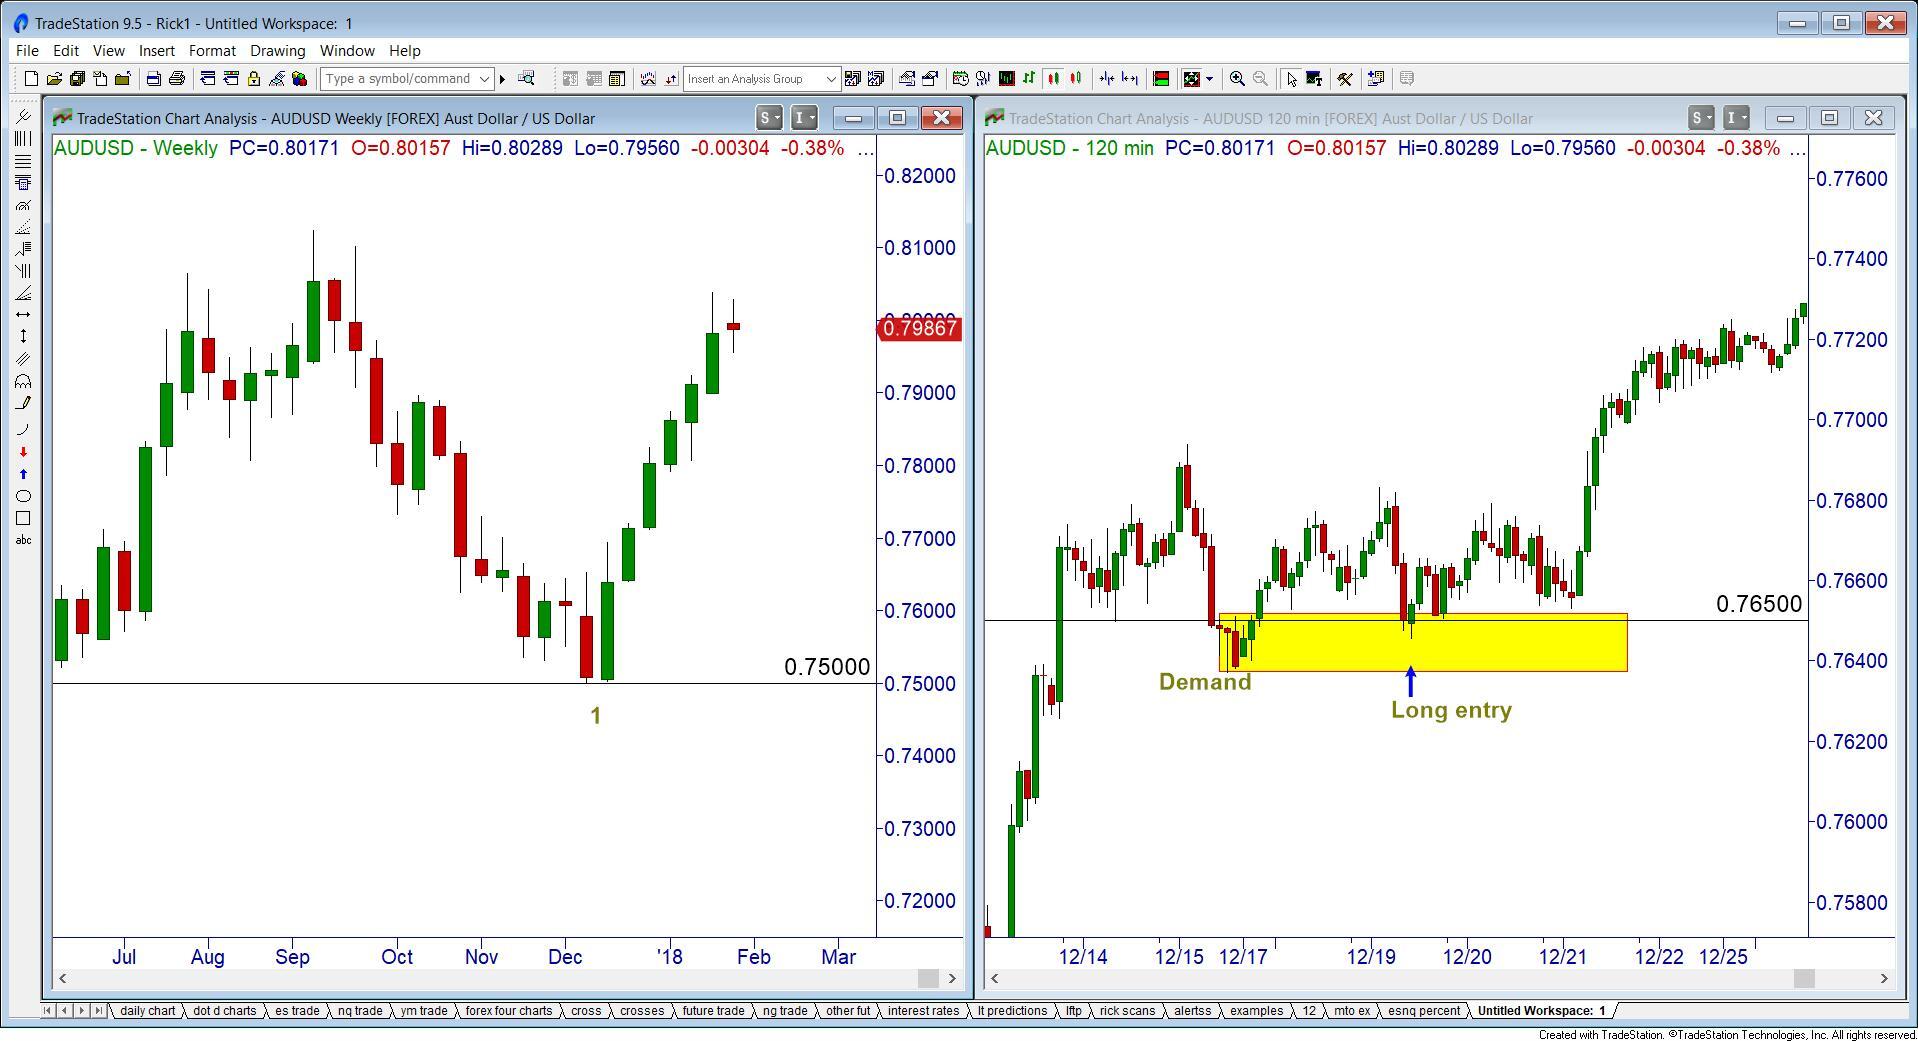
After the major players have given you the hint that they are no longer shorting, but going long, we can now look for long trades on our smaller timeframes. In the corresponding one-hour chart, you had an opportunity to buy on 12/19 near the 0.7650 mark. While it took a couple of days for you to make a lot of pips, the signal was clear.
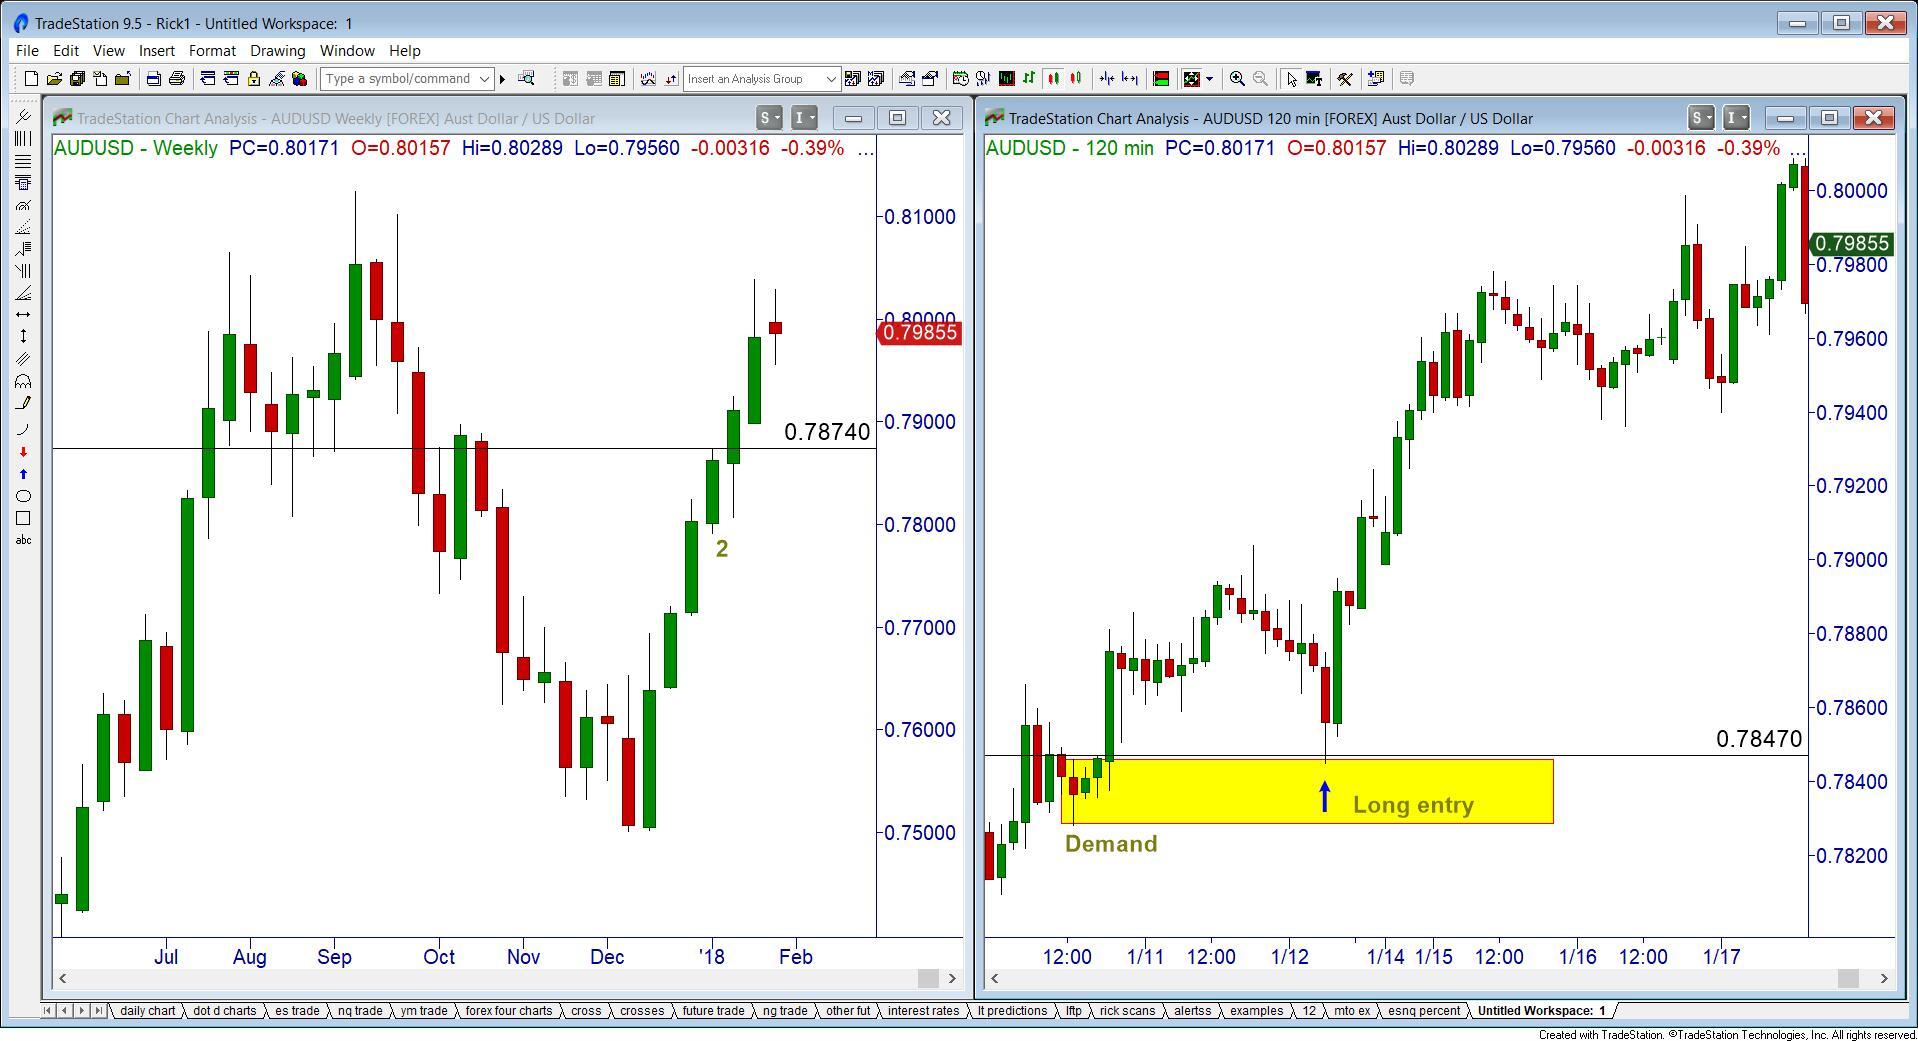
OK, let’s say you missed that one, end of year holidays and all. How about one after the start of the year?
In this next picture, you noticed a weekly high of about 0.7874 that happened on Jan 5. (This weekly candle is marked 2). Once you had permission to look for long trades, as the previous weekly candles high had been broken, you could have gotten long around the 0.7847 mark. By using this technique, you won’t be early or first to these trades by any means; however, your probability of being correct in this direction will go up substantially. Now, seeing where this chart is currently trading (at the time of this writing), I wouldn’t still be going long using these time frames. If you are long, please continue to manage your winning trades appropriately!
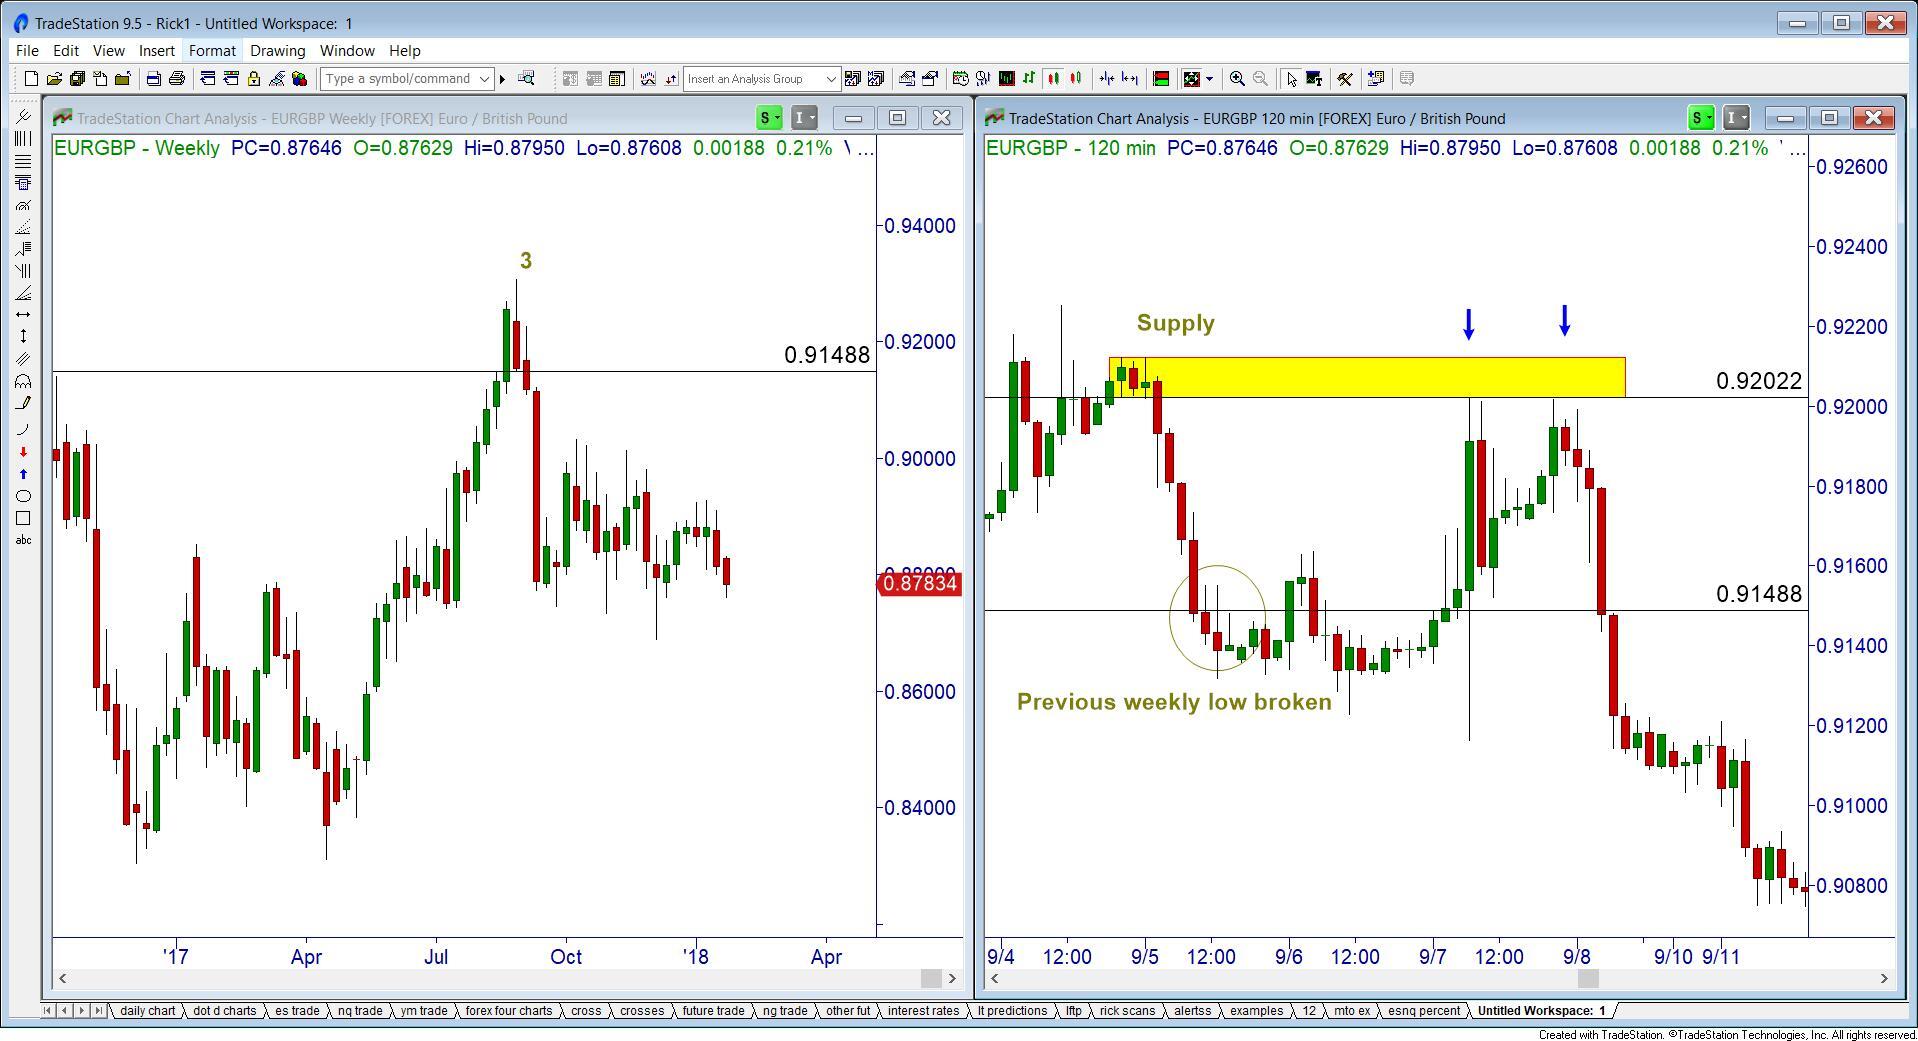
Now, how about an example for the short side? The weekly low on the EURGBP was on Sept 1, and was broken the following week on Sept 5. (Weekly candle marked as 3). Once you had your short bias, or your permission to look for short trades, we must wait for a rally into supply to take any short opportunities. On both Sept 7 and 8 we had chances to get into this short trade.
Now, I must make a couple of things super duper clear. This technique to get a long trade or short trade bias works very well during up or down trending markets. When you find a chart that is going sideways, our third trend direction, this bias technique will not help much at all! In fact, it may hurt more than it helps! The second point I want to make is, you must also take into consideration what the trend HAS BEEN. If your trend has been going UP for several weeks, taking you into a long term supply level, I would definitely NOT be looking to continue trying to find trades on the long side. On the other side, if your trend has been going DOWN for several weeks, taking you into long term demand, I wouldn’t be looking for any more short trades.
This content is intended to provide educational information only. This information should not be construed as individual or customized legal, tax, financial or investment services. As each individual's situation is unique, a qualified professional should be consulted before making legal, tax, financial and investment decisions. The educational information provided in this article does not comprise any course or a part of any course that may be used as an educational credit for any certification purpose and will not prepare any User to be accredited for any licenses in any industry and will not prepare any User to get a job. Reproduced by permission from OTAcademy.com click here for Terms of Use: https://www.otacademy.com/about/terms
Editors’ Picks

EUR/USD struggles to build on previous week's gains, stays below 1.0500
EUR/USD stays under modest bearish pressure and trades below 1.0500 on Monday. The cautious market mood supports the US Dollar and limits the pair's upside, while trading action remains subdued, with US markets remaining closed on Presidents' Day.

GBP/USD ranges near 1.2600 as US Dollar steadies
GBP/USD fluctuates in a tight channel near 1.2600 in the second half of the day on Monday. Trading volumes are likely to remain thin as financial markets in the US enjoy a log weekend in observance of the Presidents' Day holiday.

USD/JPY off lows but heavy near 151.50 amid upbeat Japan's Q4 GDP
The Japanese Yen sticks to its strong intraday gains in the wake of a strong domestic Gross Domestic Product print, which reaffirmed bets that the Bank of Japan will hike interest rates further.
Editors’ Picks
EUR/USD struggles to build on previous week's gains, stays below 1.0500
EUR/USD stays under modest bearish pressure and trades below 1.0500 on Monday. The cautious market mood supports the US Dollar and limits the pair's upside, while trading action remains subdued, with US markets remaining closed on Presidents' Day.
GBP/USD ranges near 1.2600 as US Dollar steadies
GBP/USD fluctuates in a tight channel near 1.2600 in the second half of the day on Monday. Trading volumes are likely to remain thin as financial markets in the US enjoy a log weekend in observance of the Presidents' Day holiday.

Gold clings to modest daily gains near $2,900
Gold regains its traction and trades in positive territory near $2,900 following Friday's sharp decline. Although financial markets in the US remain closed on Monday, investors will scrutinize political headlines and comments from Fed officials.

Five fundamentals for the week: Peace talks, Fed minutes and German election stand out Premium
US President Donald Trump remains prominent, especially in a week when high-level peace talks kick off. Nevertheless, the Commander-in-Chief competes with the world's most powerful central bank, and other events are of interest as well.

Bitcoin Price Forecast: BTC stalemate soon coming to an end
Bitcoin price has been consolidating between $94,000 and $100,000 for almost two weeks. Amid this consolidation, investor sentiment remains indecisive, with US spot ETFs recording a $580.2 million net outflow last week, signaling institutional demand weakness.
RECOMMENDED LESSONS
Making money in forex is easy if you know how the bankers trade!
Discover how to make money in forex is easy if you know how the bankers trade!
5 Forex News Events You Need To Know
In the fast moving world of currency markets, it is extremely important for new traders to know the list of important forex news...
Top 10 Chart Patterns Every Trader Should Know
Chart patterns are one of the most effective trading tools for a trader. They are pure price-action, and form on the basis of underlying buying and...
7 Ways to Avoid Forex Scams
The forex industry is recently seeing more and more scams. Here are 7 ways to avoid losing your money in such scams: Forex scams are becoming frequent. Michael Greenberg reports on luxurious expenses, including a submarine bought from the money taken from forex traders. Here’s another report of a forex fraud. So, how can we avoid falling in such forex scams?
What Are the 10 Fatal Mistakes Traders Make
Trading is exciting. Trading is hard. Trading is extremely hard. Some say that it takes more than 10,000 hours to master. Others believe that trading is the way to quick riches. They might be both wrong. What is important to know that no matter how experienced you are, mistakes will be part of the trading process.

The Best Brokers of the Year
SPONSORED Explore top-quality choices worldwide and locally. Compare key features like spreads, leverage, and platforms. Find the right broker for your needs, whether trading CFDs, Forex pairs like EUR/USD, or commodities like Gold.