![]() Przemyslaw Radomski, CFA
Przemyslaw Radomski, CFA
Sunshine Profits
New yearly low in the GDXJ, plunging silver prices, and louder questions about the upcoming bottom. Let’s start.
New 2023 lows confirmed
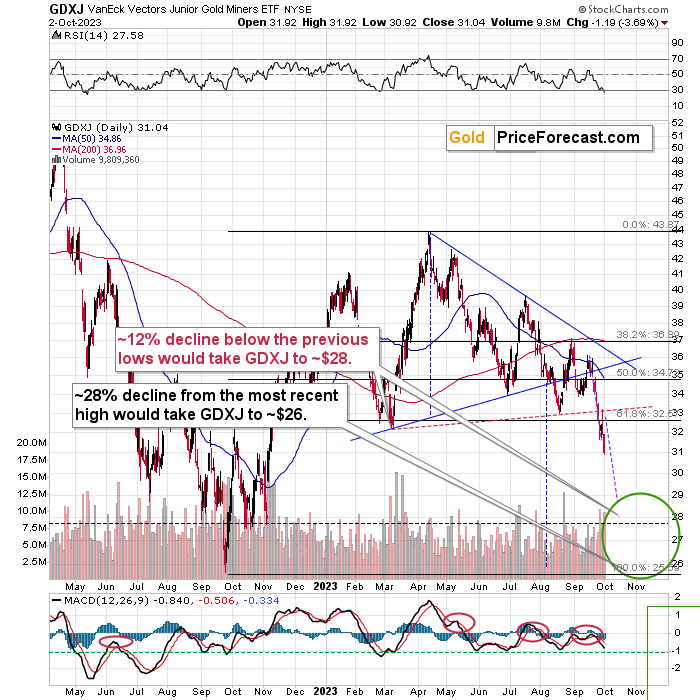
Yesterday’s session was the first one that we saw this year when the GDXJ briefly moved below $31. It then moved slightly higher and closed at $31.04, but the correction was tiny, and it didn’t result in a major daily reversal.
In my yesterday’s gold price analysis, I wrote the following:
The GDXJ topped on Friday at $33.20 and then it declined by almost a full dollar, closing the week at $32.23.
In this way, junior miners verified their move to new 2023 lows through:
-
Weekly close below the previous 2023 lows
-
Three consecutive daily closes below the previous 2023 lows
-
The comeback to the previously broken support line, which was followed by a decline, which verified the line as resistance.
This means that whatever rally was likely to happen based on Wednesday’s and Thursday’s reversals might have already happened.
The slide to new lows can now continue.
Also, please note that I wrote that I didn’t think that it was a good idea to adjust the short position even despite the possibility of seeing an intraday rally here.
Now, the question is, how low would be too low for the mining stocks? In other words – when are they likely to bottom, at least temporarily?
As you can see on the above chart, I marked a downside target area with a green ellipse – that’s where the next bottom is likely to form in my opinion – between the levels slightly above $28 and approximately $26.
Why? There’s no significant support above $28, and the support provided by $26 (the 2022 low) is very strong.
The higher of those targets is also supported by the technique that suggests that a decline that follows a consolidation is likely to be similar to the one that preceded it. We just saw a tiny consolidation, and I marked the preceding decline with a purple dashed line. I copied it to the current situation, and it points to price levels below $29 as the next target. This technique doesn’t have to be precise – it can work on a near-to basis, so the support provided by the October and November (2022) lows seems to be a more likely target.
- “But PR, the RSI is below 30! Shouldn’t we get a rebound right away, because of that? The situation seems oversold…”
It’s true that when the RSI moves below 30, it often creates a buying opportunity, but this is the case during “normal times”. Miners just broke to new yearly lows, and the link to 2013 has been in place for many months. The consequences are finally starting (!) to hit the market.
Simply put, these are not “normal times”.
Mirroring 2013 trends
Do you know how well this classic RSI signal worked for the GDXJ during the 2013 slide? Let’s check.
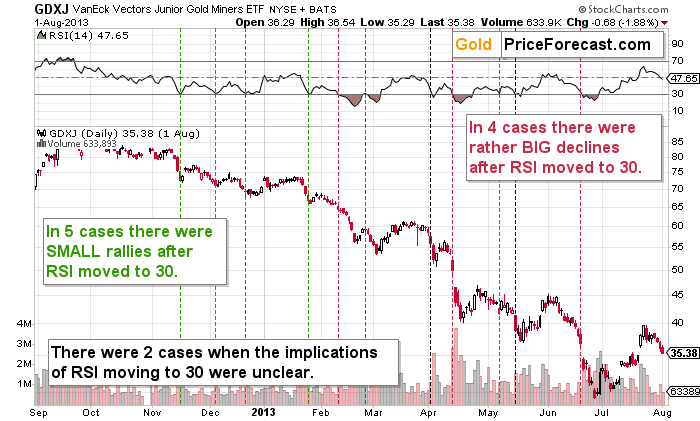
The vertical, dashed lines mark situations when RSI moved to 30. In the first part of the decline, there were small rallies once the RSI flashed its classic buy signal. After that, when the pace of decline picked up, the classic buy signals from the RSI were usually either followed by big declines (4 cases), unclear action (2 cases), or a tradable rally (1 case).
The pace of the decline just picked up. We entered into the “watch out!” territory as techniques that worked previously might not work as well in the next several months.
RSI at 20 might be an important buy signal, but I suggest combining this indication with other techniques before making any adjustments to one’s trades.
One would be to check directly what happened back in 2013.
Obviously, the world was a different place a decade ago with regard to many things, but not with regard to things that matter the most when it comes to why price moves happen in the same (or similar) way over and over again: human emotions. When presented with similar situations price- and volume-wise, people tend to react similarly. This means that when we notice what part of history is being repeated to some extent, we can use that insight to project the next price moves.
Of course, this will never be 100% accurate, and that’s not the point. The point of the analogy is to be “accurate enough” to be useful. And when you combine enough “accurate enough” techniques, you get a quality gold price forecasting system. Naturally, there will always be mistakes (still, we’re on a 10-winning-trade streak and the current short position in GDXJ is very profitable, too).
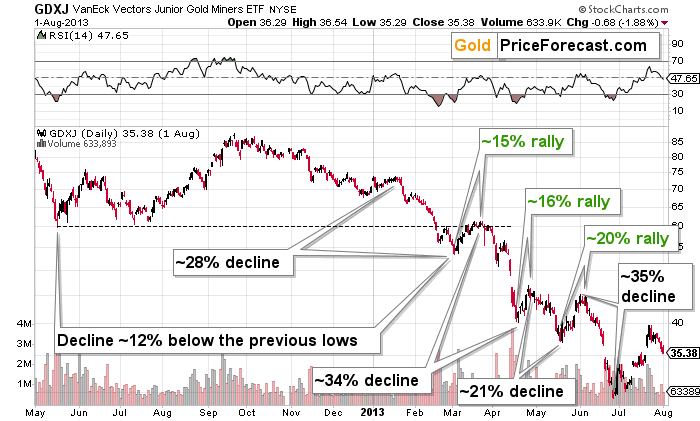
What does 2013 tell us about 2023? It tells us quite a lot, but for the sake of this analysis, let’s focus on the current situation. When the GDXJ broke below its previous lows, it continued to decline until:
-
GDXJ declined about 28% from its most recent top.
-
GDXJ declined about 12% below its previous lows.
With the above in mind, please take one more look at the first of today’s charts. The texts that I placed on it will now make more sense.
Both downside target levels are confirmed by the link to 2013! Magic? No – the history simply tends to rhyme just as human reactions to similar price events tend to be similar.
Which of those targets will stop the current decline? The reply might come from gold.
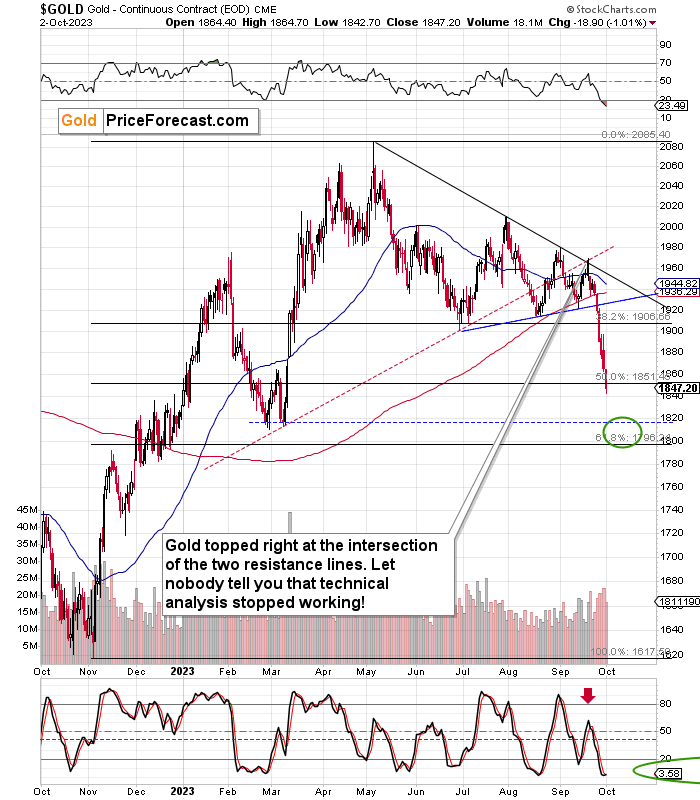
Ever since topping at its triangle-vertex-based reversal point (which worked perfectly – technical analysis works!), the gold price has been sliding.
In the case of gold, the next target is clearer. Gold has two support levels that are close to each other. The targets are at about $1,820 and $1,800, respectively. Out of those, the latter seems more likely to stop the decline as the gold trading technique that creates it already worked. The support is provided by the 61.8% Fibonacci retracement level, and the previous (38.2%) Fibonacci retracement levels triggered the June bottom.
This means that another $40 - $50 decline in gold might be in the cards. Also, to be precise, I mean “gold futures” – the same instrument that you see on the above chart. Spot gold is also likely to decline by that amount (approximately) starting from Monday’s closing price.
Whenever the GDXJ is with gold at about $1,800, might be its bottom. If it’s close to $28 at that time (which seems likely), we’re likely to see a corrective rally from that level.
All this means that the profits in our short position are likely to increase further. The profit-take levels for this downswing remain up-to-date, but if gold moves close to $1,800, I might quickly adjust them. I will send an intraday Alert in this case.
Want free follow-ups to the above article and details not available to 99%+ investors? Sign up to our free newsletter today!
All essays, research and information found above represent analyses and opinions of Przemyslaw Radomski, CFA and Sunshine Profits' employees and associates only. As such, it may prove wrong and be a subject to change without notice. Opinions and analyses were based on data available to authors of respective essays at the time of writing. Although the information provided above is based on careful research and sources that are believed to be accurate, Przemyslaw Radomski, CFA and his associates do not guarantee the accuracy or thoroughness of the data or information reported. The opinions published above are neither an offer nor a recommendation to purchase or sell any securities. Mr. Radomski is not a Registered Securities Advisor. By reading Przemyslaw Radomski's, CFA reports you fully agree that he will not be held responsible or liable for any decisions you make regarding any information provided in these reports. Investing, trading and speculation in any financial markets may involve high risk of loss. Przemyslaw Radomski, CFA, Sunshine Profits' employees and affiliates as well as members of their families may have a short or long position in any securities, including those mentioned in any of the reports or essays, and may make additional purchases and/or sales of those securities without notice.
Recommended Content
Editors’ Picks
EUR/USD stabilizes near 1.0500, looks to post weekly losses

EUR/USD extended its daily decline toward 1.0500 in the second half of the American session, pressured by the souring market mood. Despite the bullish action seen earlier in the week, the pair remains on track to register weekly losses.
GBP/USD falls below 1.2150 as USD rebounds

Following an earlier recovery attempt, GBP/USD turned south and declined below 1.2100 in the second half of the day on Friday. The negative shift seen in risk mood amid rising geopolitical tensions helps the US Dollar outperform its rivals and hurts the pair.
Gold advances to fresh multi-week highs above $1,920

Gold extended its daily rally and climbed above $1,920 for the first time in over two weeks on Friday. Escalating geopolitical tensions ahead of the weekend weigh on T-bond yields and provide a boost to XAU/USD, which remains on track to gain nearly 5% this week.
Bitcoin could be an alternative to US-listed companies but not in the short term

Bitcoin has dipped below $27,000, adding to the subdued cryptocurrency market sentiment. While short-term price concerns persist, analysts predict a rebound based on historical figures.
Nvidia Stock Forecast: NVDA slips as Biden administration attempts to close AI chip loophole

Nvida's stock price opened marginally lower on Friday after Reuters reported that the Biden administration is attempting to close a loophole that allowed Chinese companies access to state-of-the-art computer chips used for AI.