What happened last week?
In the US:
US inflation data was the key event last week; according to the Bureau of Labour Statistics (BLS), headline (all items) consumer price inflation increased 3.7% on a year-over-year basis for August, up from 3.2% in July and just north of economists’ estimates of 3.6%. Core inflation, which excludes energy and food prices, eased to 4.3% in August for the same period, as expected, down from 4.7% in July. From July to August, headline inflation rose 0.6%, up from 0.2% in July (in line with market forecasts), while monthly core inflation rose 0.3%, a touch higher than the 0.2% market consensus and up from 0.2% in July. The largest contributor to the monthly headline increase in inflation was petrol prices—surging more than 10% in August—with the energy index jumping 5.6% (all of the energy price indexes showed an increase).
Headline US PPI (Producer Price Index) inflation rose 1.6% in August on a year-on-year basis, up from 0.8% in July and marking its largest increase in a year. The month-on-month measure increased 0.7%, up from 0.4% in July. According to the Bureau of Labour Statistics (BLS), similar to the CPI release, the headline increase was largely driven by a jump in energy goods, which rose 10.5% on a month-on-month basis, up from 0.8% the month prior; this was boosted by a surge in gasoline prices, up 20% on the month! Core PPI inflation, which excludes energy and food components, came in line with estimates showing an increase of 0.2% and 2.2% on a month-on-month and year-on-year basis, respectively.
US retail sales increased by more than expected at 0.6% in August, comfortably north of economists’ estimates of 0.1%; Ex autos were up 0.6% against 0.4% market consensus. The US PPI and retail sales data exhibited big upside surprises, largely attributed to the rise in oil prices.
The September New York Empire State Manufacturing Index rebounded 21 points to 1.9, following a -19.0 drop and against economists’ estimates of -10.0.
The preliminary University of Michigan consumer sentiment survey dropped -1.8 points to 67.7 in September. Further, we saw a drop in inflation expectations to 3.1% in September, down from 3.5% the prior month. This marks the lowest level in over two years.
In Europe:
The European Central Bank (ECB) raised all three key benchmark rates by 25bps, pulling the Deposit Facility Rate to an all-time high of 4.00%. The central bank’s inflation forecast was revised higher for this year and the next but lower in 2025. ECB projections forecast an increase in inflation this year from 5.4% to 5.6%, and from 3.0% to 3.2% in 2024 and finally from 2.2% to 2.1% in 2025. The underlying reason behind its upward revisions is due to higher energy prices. Regarding growth, ECB projections forecast that economic activity will contract to 0.7% this year, down from 0.9% and from 1.5% to 1.0% in 2024. ECB President Christine Lagarde took to the stage shortly after the rate announcement and hinted that we are nearing the end of the policy-tightening schedule but never explicitly confirmed anything.
In the UK:
As expected, UK unemployment ticked higher to 4.3% in July (its highest rate since late 2021 and marks its third consecutive monthly rise), up from 4.2%, according to the Office for National Statistics (ONS). UK earnings also continued to increase in the three months to July compared to a year ago, despite unemployment rising. Average pay—including bonuses—rose 8.5% (a record high aside from the pandemic period), while average pay excluding bonuses matched the previous month at 7.8% for the same period. However, while earnings are still above inflation, it must be noted that the wage increase was aided by the one-off bonus payments to NHS and Civil Service Workers over the summer (June and July) to end strikes.
The latest UK GDP revealed that economic activity fell by -0.5% in July. With all the main sectors contributing to the fall in GDP (largely driven by strike action, poor weather and cost of living), this marked its fastest contraction since earlier this year, following a 0.5% rise in economic activity in June. Still, the UK shows 0.2% growth in the three months to July.
In Australia:
Aussie jobs data revealed that the economy added 64,900 new jobs to the economy in August, comfortably beating expectations of 25,400 and considerably higher than July’s -1,400 fall. While it must be said that a large portion (almost all, in fact) were part-time jobs, this potentially throws a spanner in the works for the Reserve Bank of Australia (RBA), which will meet again on 3 October (markets are almost fully pricing in that the central bank will stay put at 4.10%). Unemployment was unchanged at 3.7% and in line with market consensus.
In China:
We had some good news out of China on Friday; industrial production and retail sales numbers out of China posted a beat across the board for August, up 4.5% and 4.6% on a year-on-year calculation, respectively.
This week…
Four major central banks.
Four rate decisions.
This is going to be a busy week.
The most important central banks, of course, will be the Fed and the Bank of England (BoE); this is followed by the Swiss National Bank (SNB) and the Bank of Japan (BoJ).
Kicking things off will be the FOMC rate decision on Wednesday at 6 pm GMT; economists and markets widely expect the Fed to hold the line at the current Fed Funds target range (5.25%-5.50%). The quarterly FOMC projections and the dot-plot will accompany this meeting, which, given the market pricing a no-change, will be what most market participants monitor this week. It is unlikely that the Fed’s so-called dot-plot will change by much at this meeting, meaning the Fed will perhaps leave the additional rate hike on the table for this year, particularly in light of recent inflation numbers and the resilience in the US economy. Many desks claim this will be a ‘hawkish hold’, thus leaving the door ajar for further policy firming if necessary. It will also be interesting to see how many rate cuts are forecasted for 2024, as well as the updated Fed forecasts for GDP and unemployment.
The US dollar, therefore, will be widely watched this week; according to the US Dollar Index, we ended a ninth week in positive territory, up +0.3%. The buck is in an interesting position right now, benefitting from resilient economic conditions, attractive yield and safe-haven demand, hence its continued outperformance of late.
Thursday welcomes the SNB and the BoE at 7:30 am and 11:00 am GMT, respectively. Both central banks are expected to raise rates by 25bps this week. Should the BoE press forward with another rate hike, the vote will be interesting to watch and may be split. As a result, this may see an upside spike in the GBP on the back of the rate hike, but it will likely be short-lived, particularly if there’s less commitment from the MPC members in the vote. Also, out of the UK—a day ahead of the BoE rate decision—we’ll receive the latest UK inflation numbers for August, which, as of writing, the median estimate shows that year-on-year headline inflation is expected to rise to 7.1% (up from 6.8%), with core inflation for the same period estimated to ease slightly to 6.8%, down from 6.9%. Sterling finished another week underwater against the US dollar last week and is poised to shake hands with key weekly support from $1.2331.
Friday will see the BoJ policy decision at 3 am GMT, which is anticipated to hold pat on rates; therefore, it is doubtful we’ll see much here. We also will see the eurozone, UK and US global manufacturing and services PMIs later Friday, all of which (aside from US services) remain in contractionary territory across the board and are projected to remain so for September’s release.
G10 FX (5-day change):
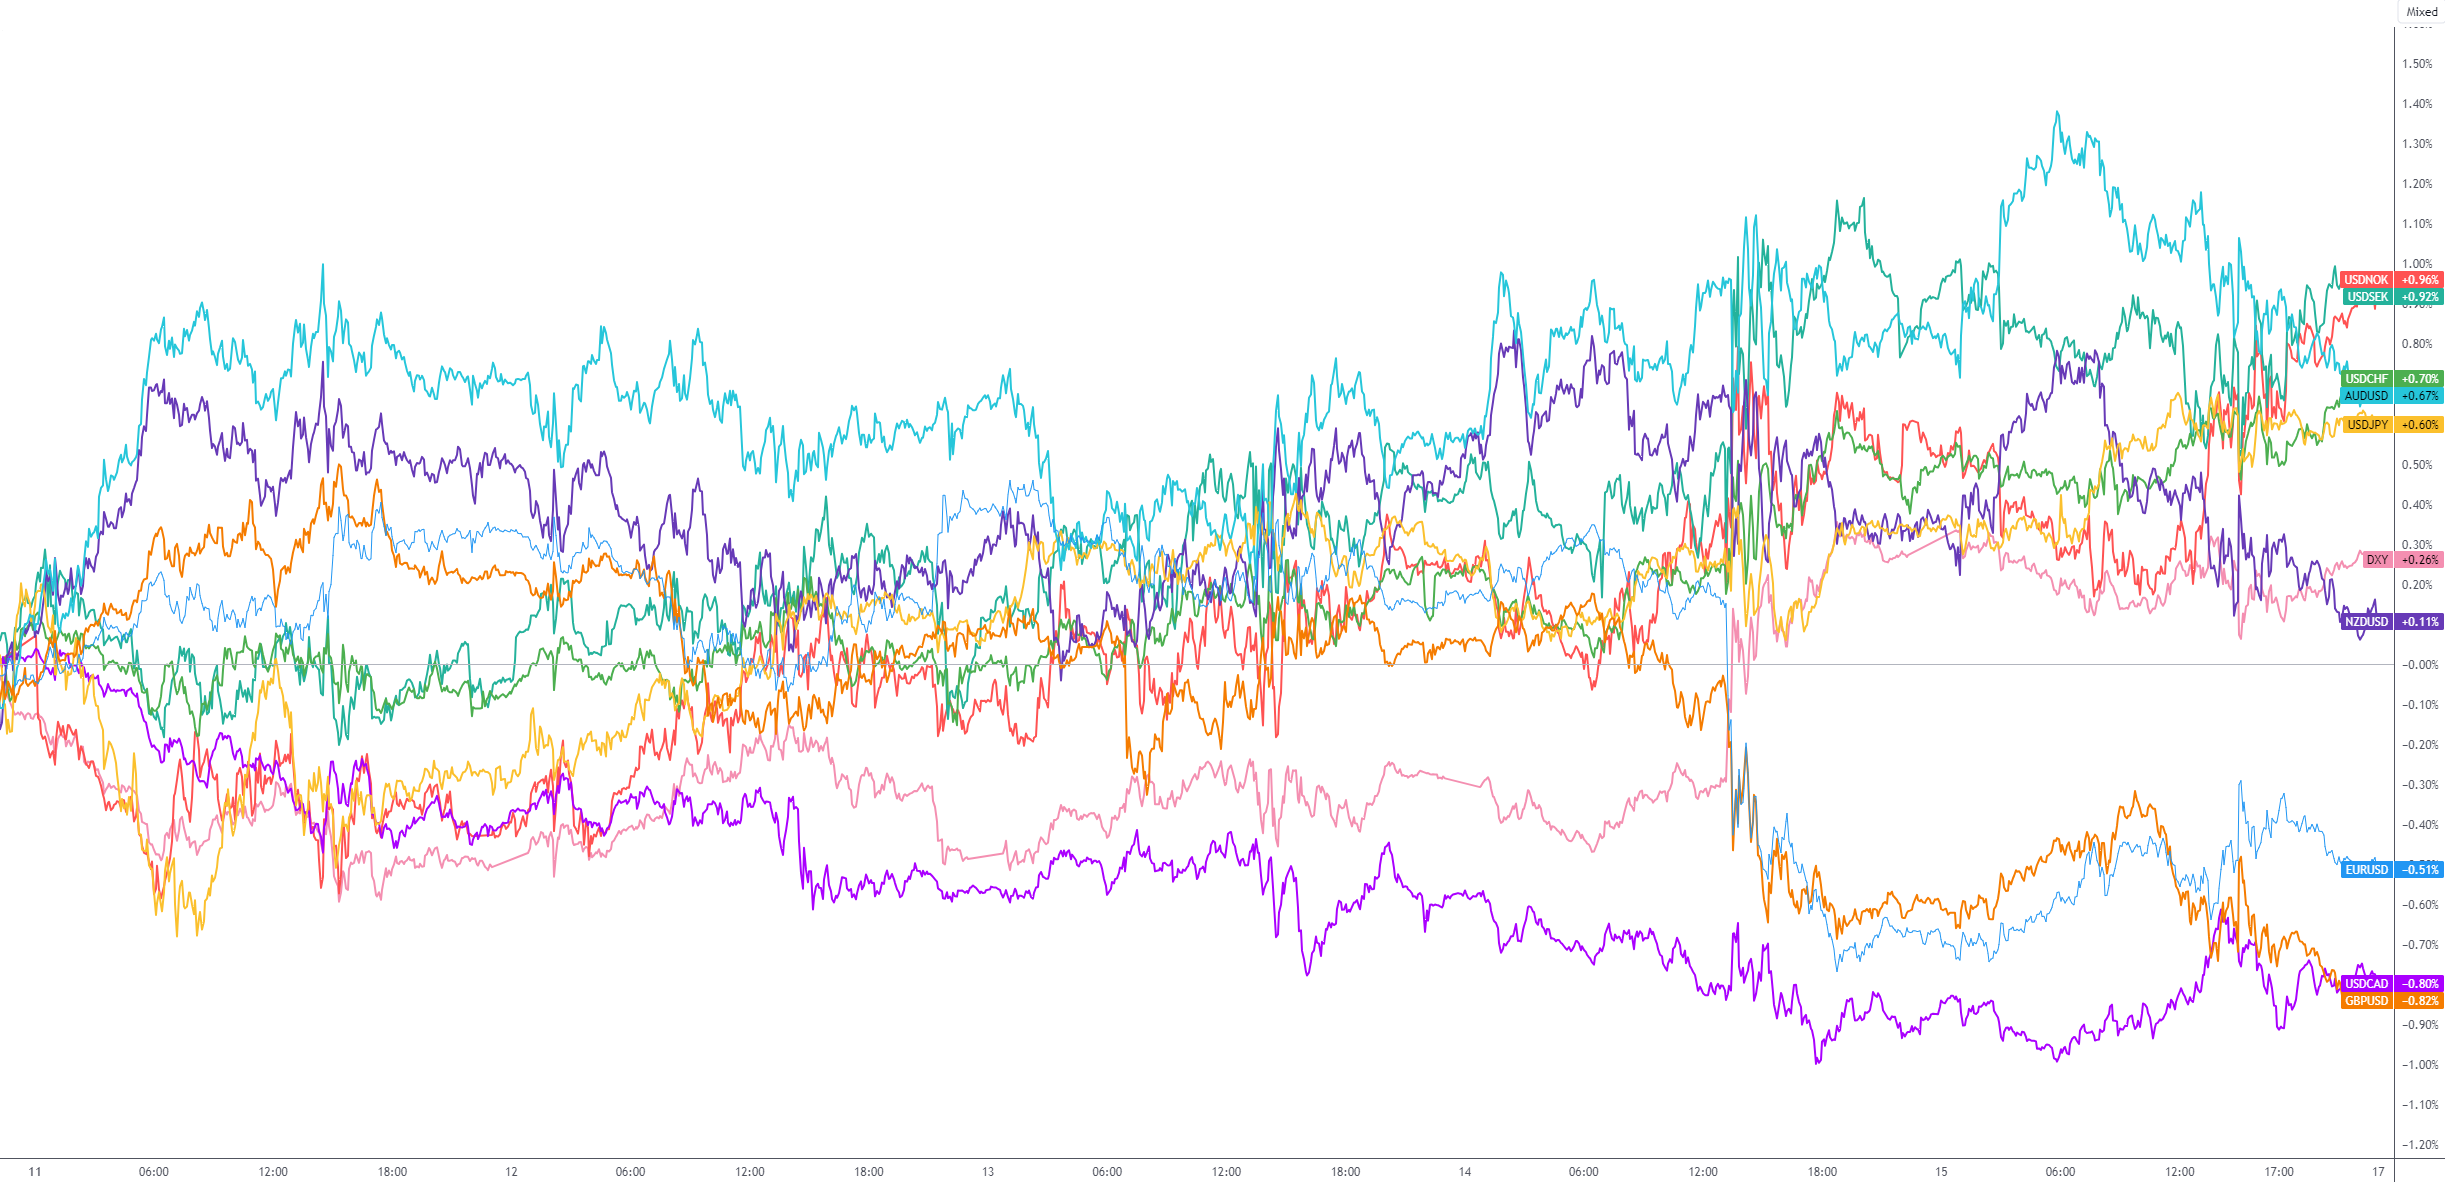
Charts: TradingView
Technical perspective for key markets
Dollar bulls remain on the offensive
The dollar is proving relentless. Up +0.3% on the week, this marks the greenback’s ninth consecutive weekly gain. Technically, however, this is not a surprise.
The monthly timeframe’s long-term trend has been north since mid-2008, and the Q4 (2022) correction has likely been viewed as a dip-buying opportunity from monthly support at 99.67, as noted in previous research.
With USD bulls remaining on the offensive now—the monthly timeframe exhibits scope to approach resistance as far north as 109.33—and the daily timeframe making its way above resistance at 105.04 (now marked support) in the second half of last week, additional outperformance could be seen this week, targeting daily resistance at 105.76.
While the trend on both the monthly and daily timeframes supports higher prices this week, as does the Relative Strength Index (RSI) on the monthly timeframe (rebounding just north of the 50.00 centreline [positive momentum]), the daily timeframe’s RSI is displaying signs of negative divergence at overbought levels. Therefore, although higher levels are on the table this week, a correction to retest daily support from 105.04 (or even daily support at 104.42) is not out of the question (a move that may attract dip-buying in line with the underlying trend).
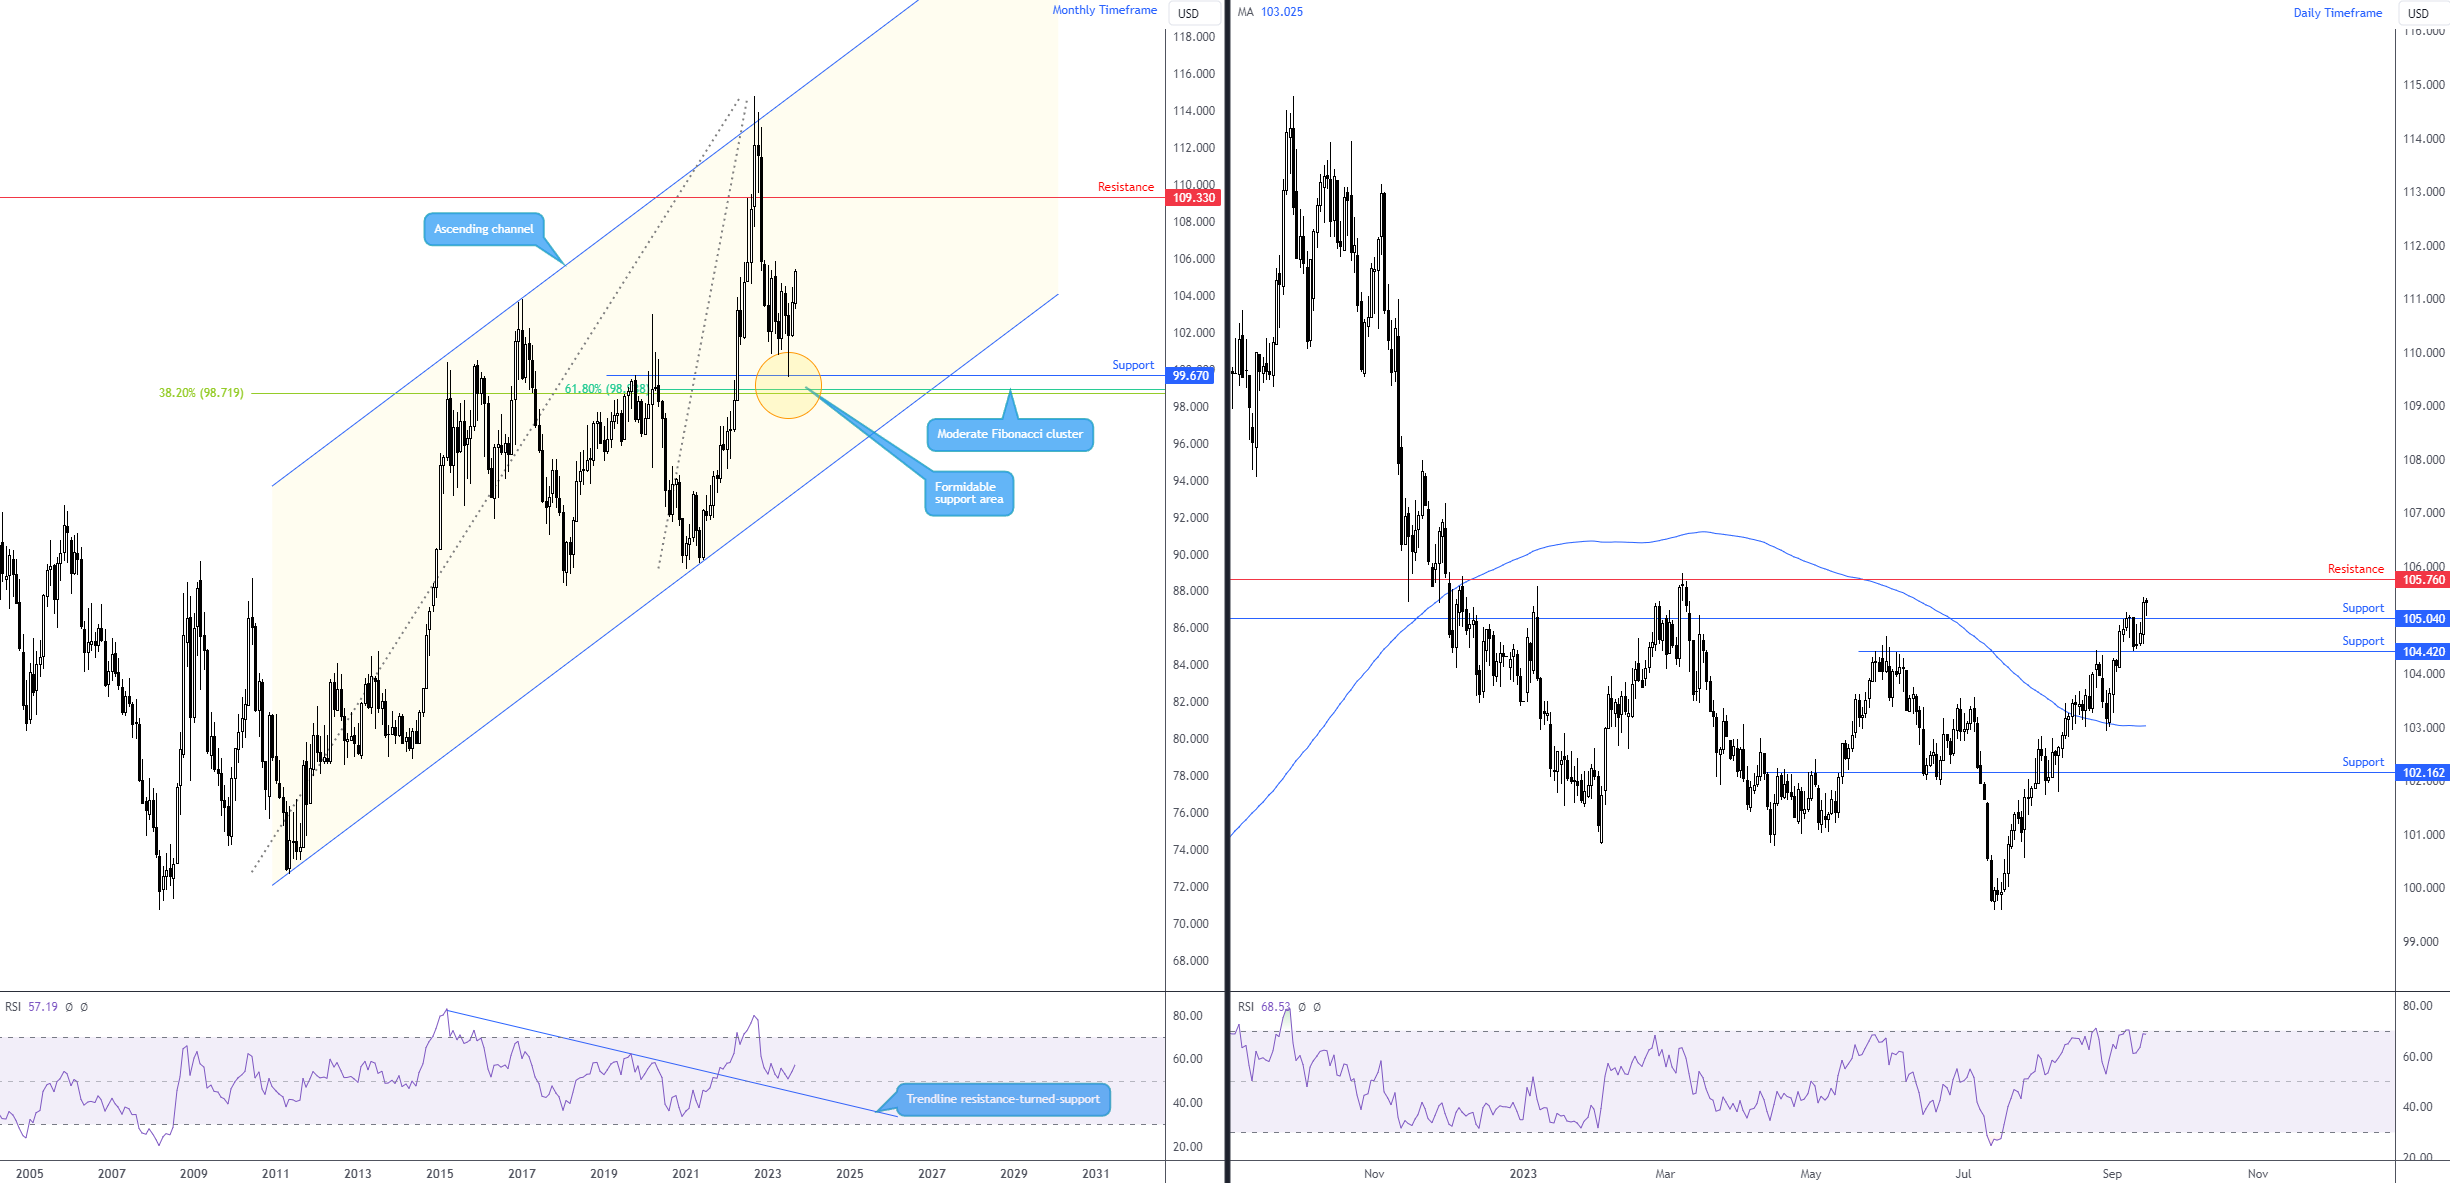
Charts: TradingView
EUR/USD continues to stress a bearish vibe
I touched on this currency pair last week and noted the following on the monthly timeframe:
Longer-term price action on the monthly timeframe rejected a key area of resistance in July at $1.1233, a base accompanied by the 50-month simple moving average at $1.1164. Subsequent flow observed selling in August, followed by the beginning of September also echoing a bearish tone, down -1.7% MTD. You will note that the trend on the monthly scale has been lower since 2008, emphasising the pullback from the $0.9536 low (September 2022) and the recent rejection of $1.1233 resistance appears to have been enough to attract a sell-on-rally theme in the longer term. The test for sellers will come at monthly support from $1.0516; clearance of this level would help corroborate a downside bias and likely encourage follow-through selling.
The monthly chart’s downside bias was recently aided by price action on the daily timeframe, crossing through bids at support from $1.0689 and unearthing the monthly support level highlighted above at $1.0516. Ultimately, technicians will likely be anticipating $1.0689 to hold as resistance this week.
Meanwhile, across the page on the H1 chart, Friday completed an AB=CD bearish formation at $1.0682 (denoted by a 100% projection ratio) just south of the current daily resistance, accompanied by a H1 1.618% Fibonacci extension ratio at $1.0683. Assuming the H1 bearish formation holds steady at the underside of daily resistance, this could prompt further selling this week, zeroing in on Thursday’s lows around $1.0632, closely followed by the $1.06 handle and then H1 support coming in at $1.0572.
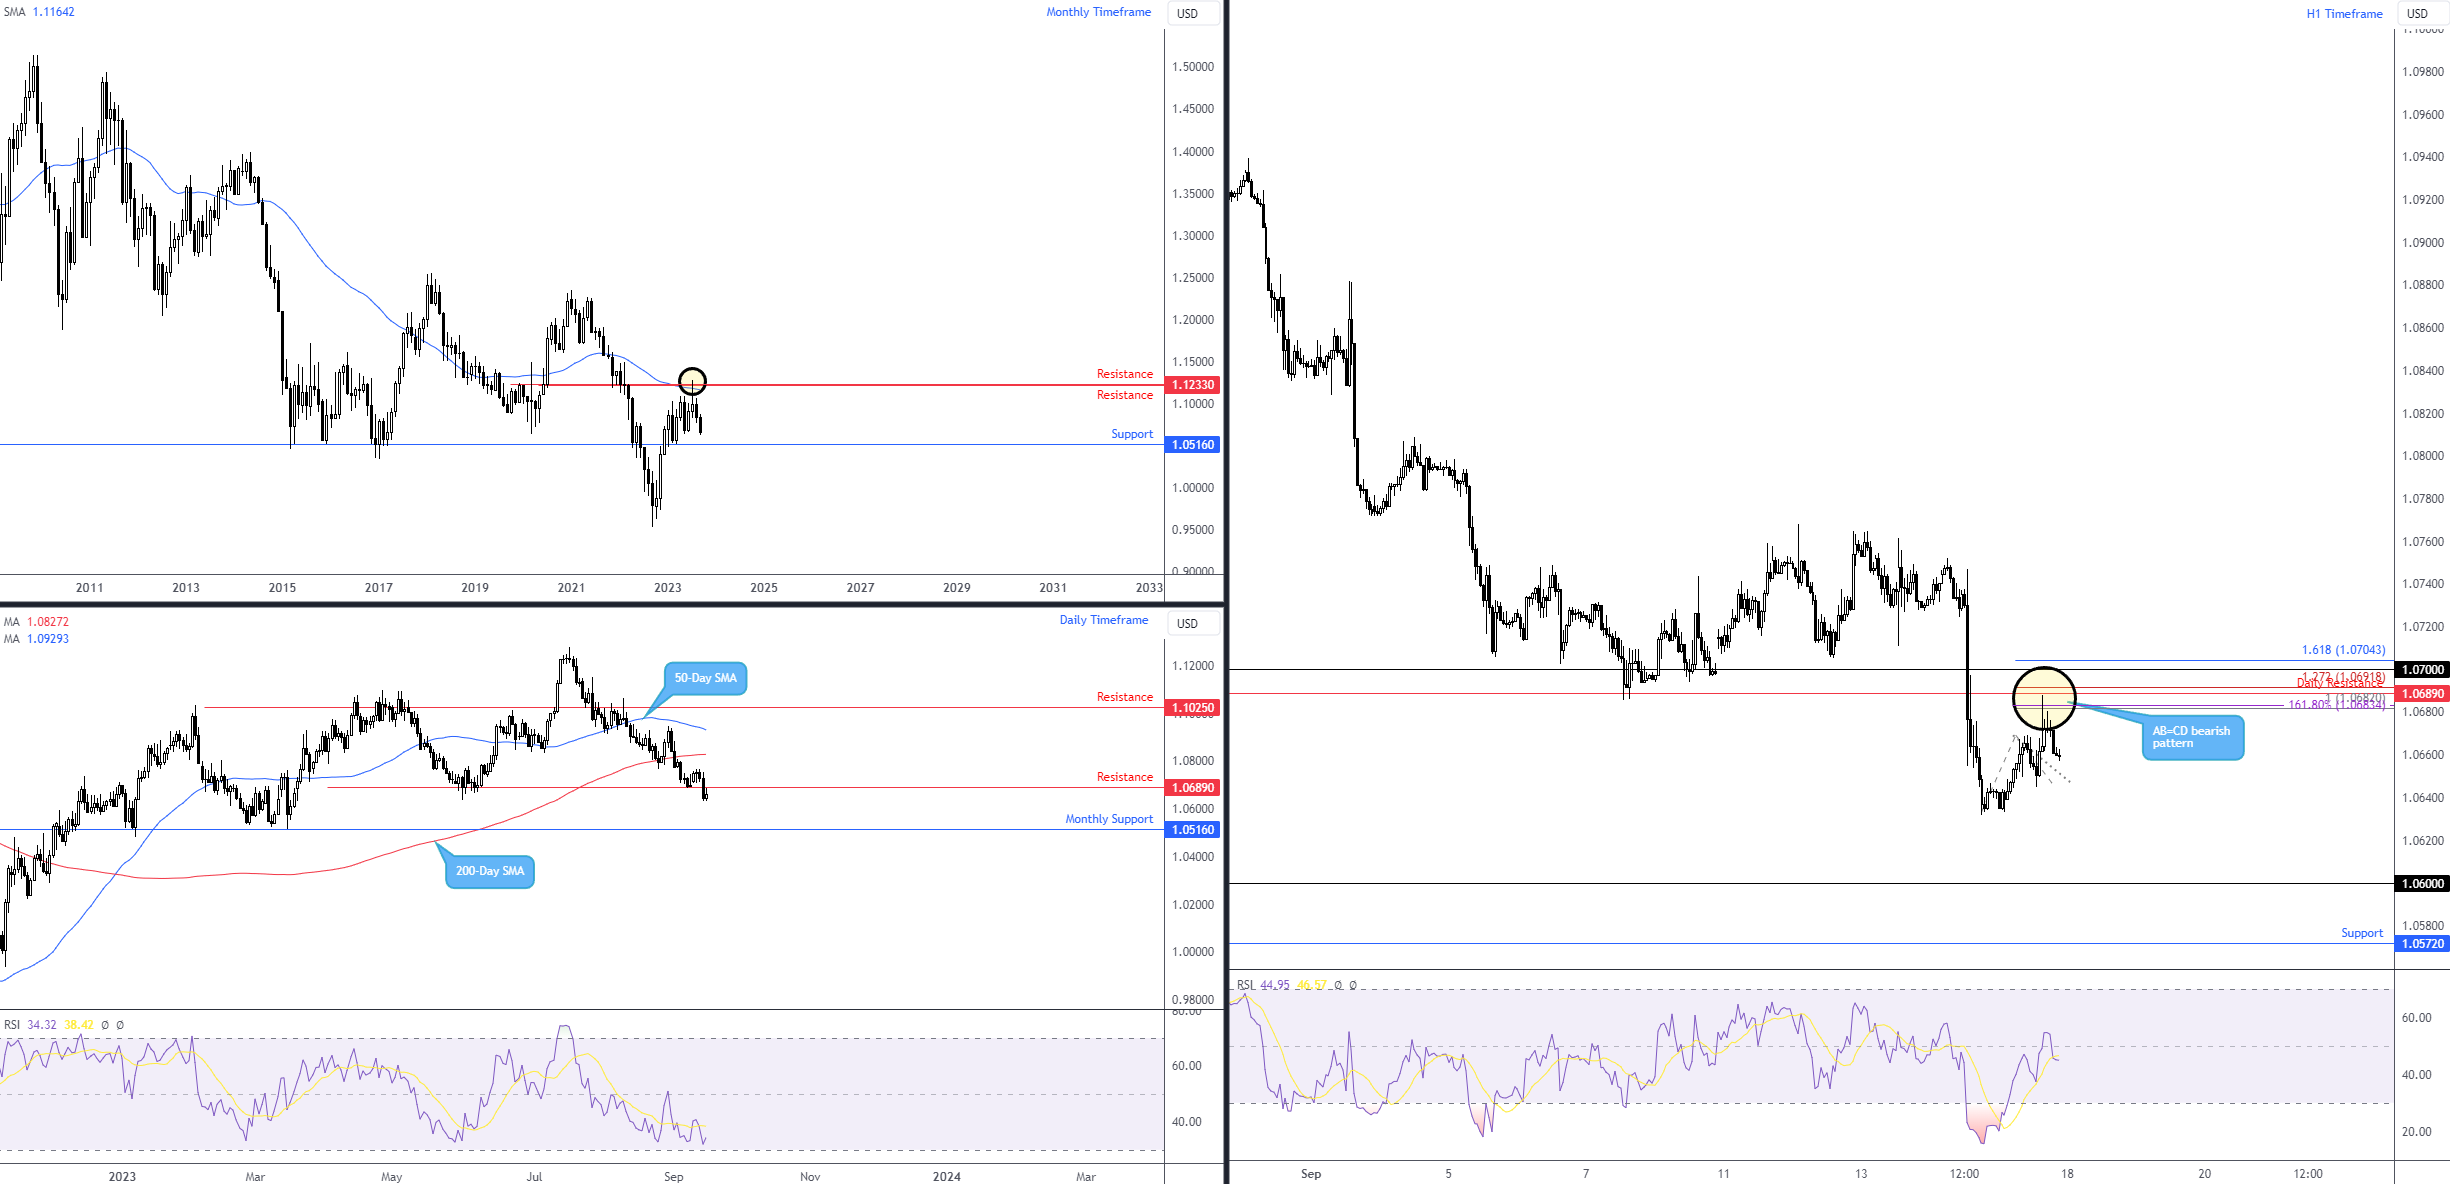
Charts: TradingView
GBP/USD retests the underside of the 200-day SMA
Against the US dollar, sterling ended another week on the ropes, down -0.7% and on track to touch gloves with weekly support at $1.2331 this week. The longer-term trend based on the weekly timeframe shows current action is establishing a correction in a market trending higher since the currency pair touched a record low of $1.1156 in September 2022.
With room for sellers to remain in control for the time being on the weekly timeframe (at least until support at $1.2331), price action on the daily timeframe, as you can see, manoeuvred beneath the 200-day simple moving average at $1.2431 on Thursday and retested the lower side of the dynamic value on Friday as resistance. Having seen the daily timeframe’s trend exhibiting a downward bias (series of lower lows and lower highs), the next support calling for attention on the daily scale is $1.2272, located a touch south of the weekly support highlighted above at 1.2331.
Analysis of the H1 timeframe reveals buyers and sellers ended the week rejecting the underside of the $1.24 psychological level. This followed an earlier rejection of resistance at $1.2438 during the early hours of London on Friday. Given that the weekly and daily timeframes demonstrate that the bears will likely remain in the driving seat for now, downside risks remain for the currency pair this week, targeting the weekly support at $1.2331, closely shadowed by H1 support at $1.2325.
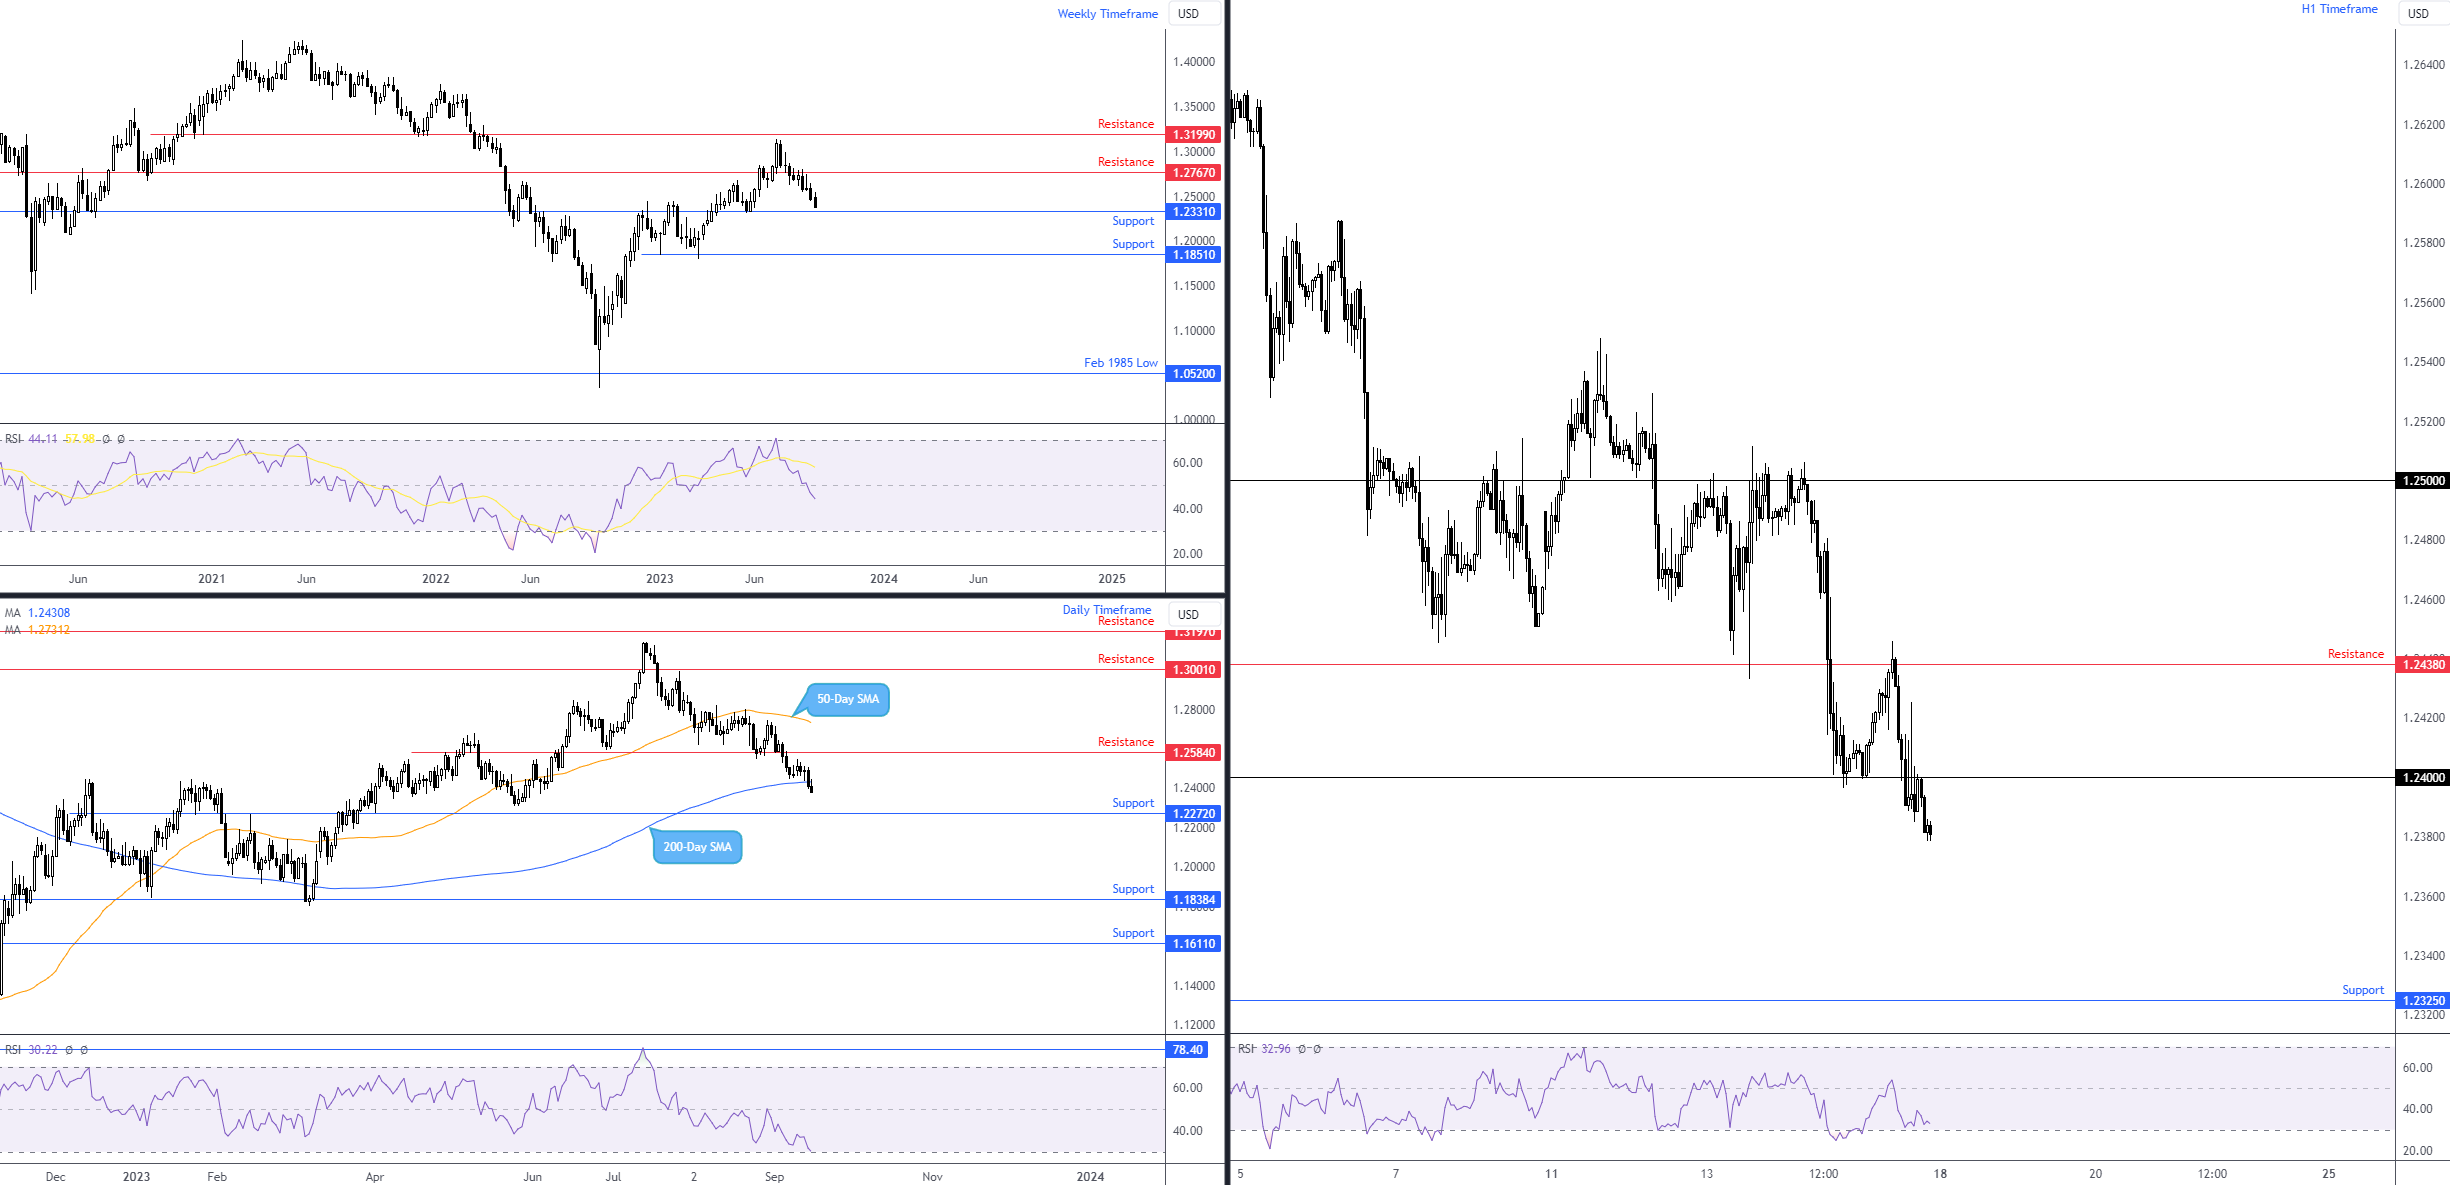
Charts: TradingView
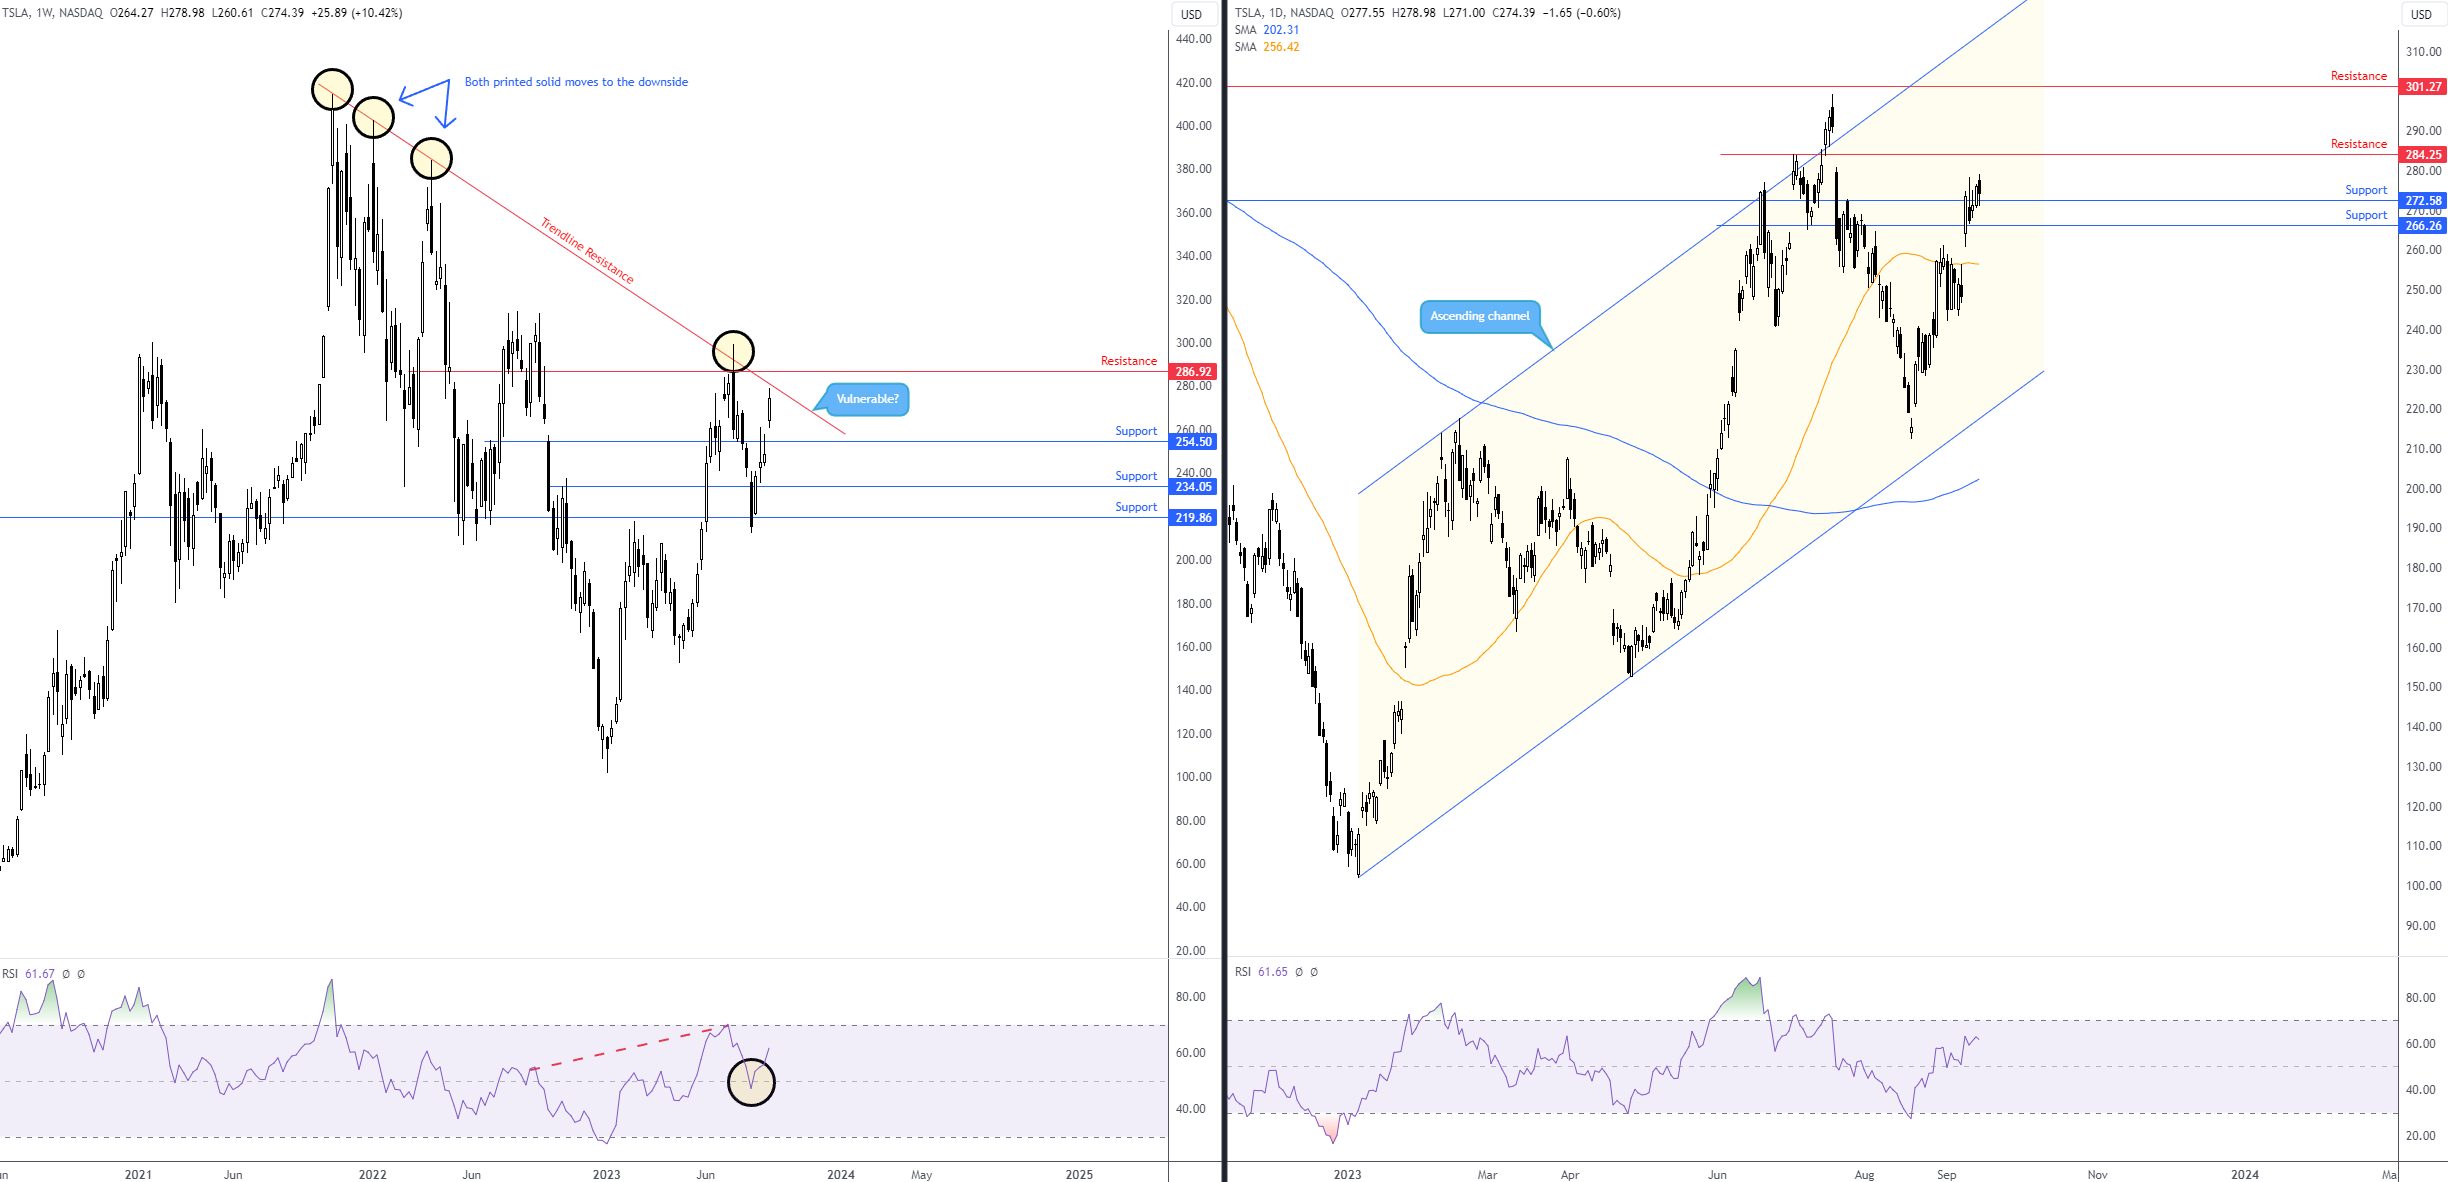
Tesla (TSLA) rallies for a fourth week
Closing higher for a fourth consecutive week after rebounding from weekly support at $219.86 (a level complemented by the Relative Strength Index [RSI] recoiling from the 50.00 centreline), Tesla (TSLA) added more than 10.0% last week.
The recent advance has landed the stock within striking distance of weekly trendline resistance, taken from the high of $414.50. In view of the lacklustre response from the last rejection of trendline resistance (July), a break of this level is potentially in the air this week, a move that would help confirm this year’s uptrend from lows of $101.81. The caveat, of course, is that the breach may be short-lived should weekly resistance stand firm at $286.92.
From the daily timeframe, Friday’s retest of resistance-turned-support at $272.58 is an encouraging sign for current buyers in this market. Technically, should the stock remain north of $272.58, drawing higher this week could be seen toward resistance at $284.25, situated near weekly resistance highlighted above at $286.92, which, by extension, implies a break of the weekly timeframe’s trendline resistance.
So, to sum up, chart studies imply a bullish push in the short to medium term until the $285.00ish region, at which point we could see sellers step in and take advantage of the buy-stops tripped north of weekly trendline resistance.
Charts: TradingView
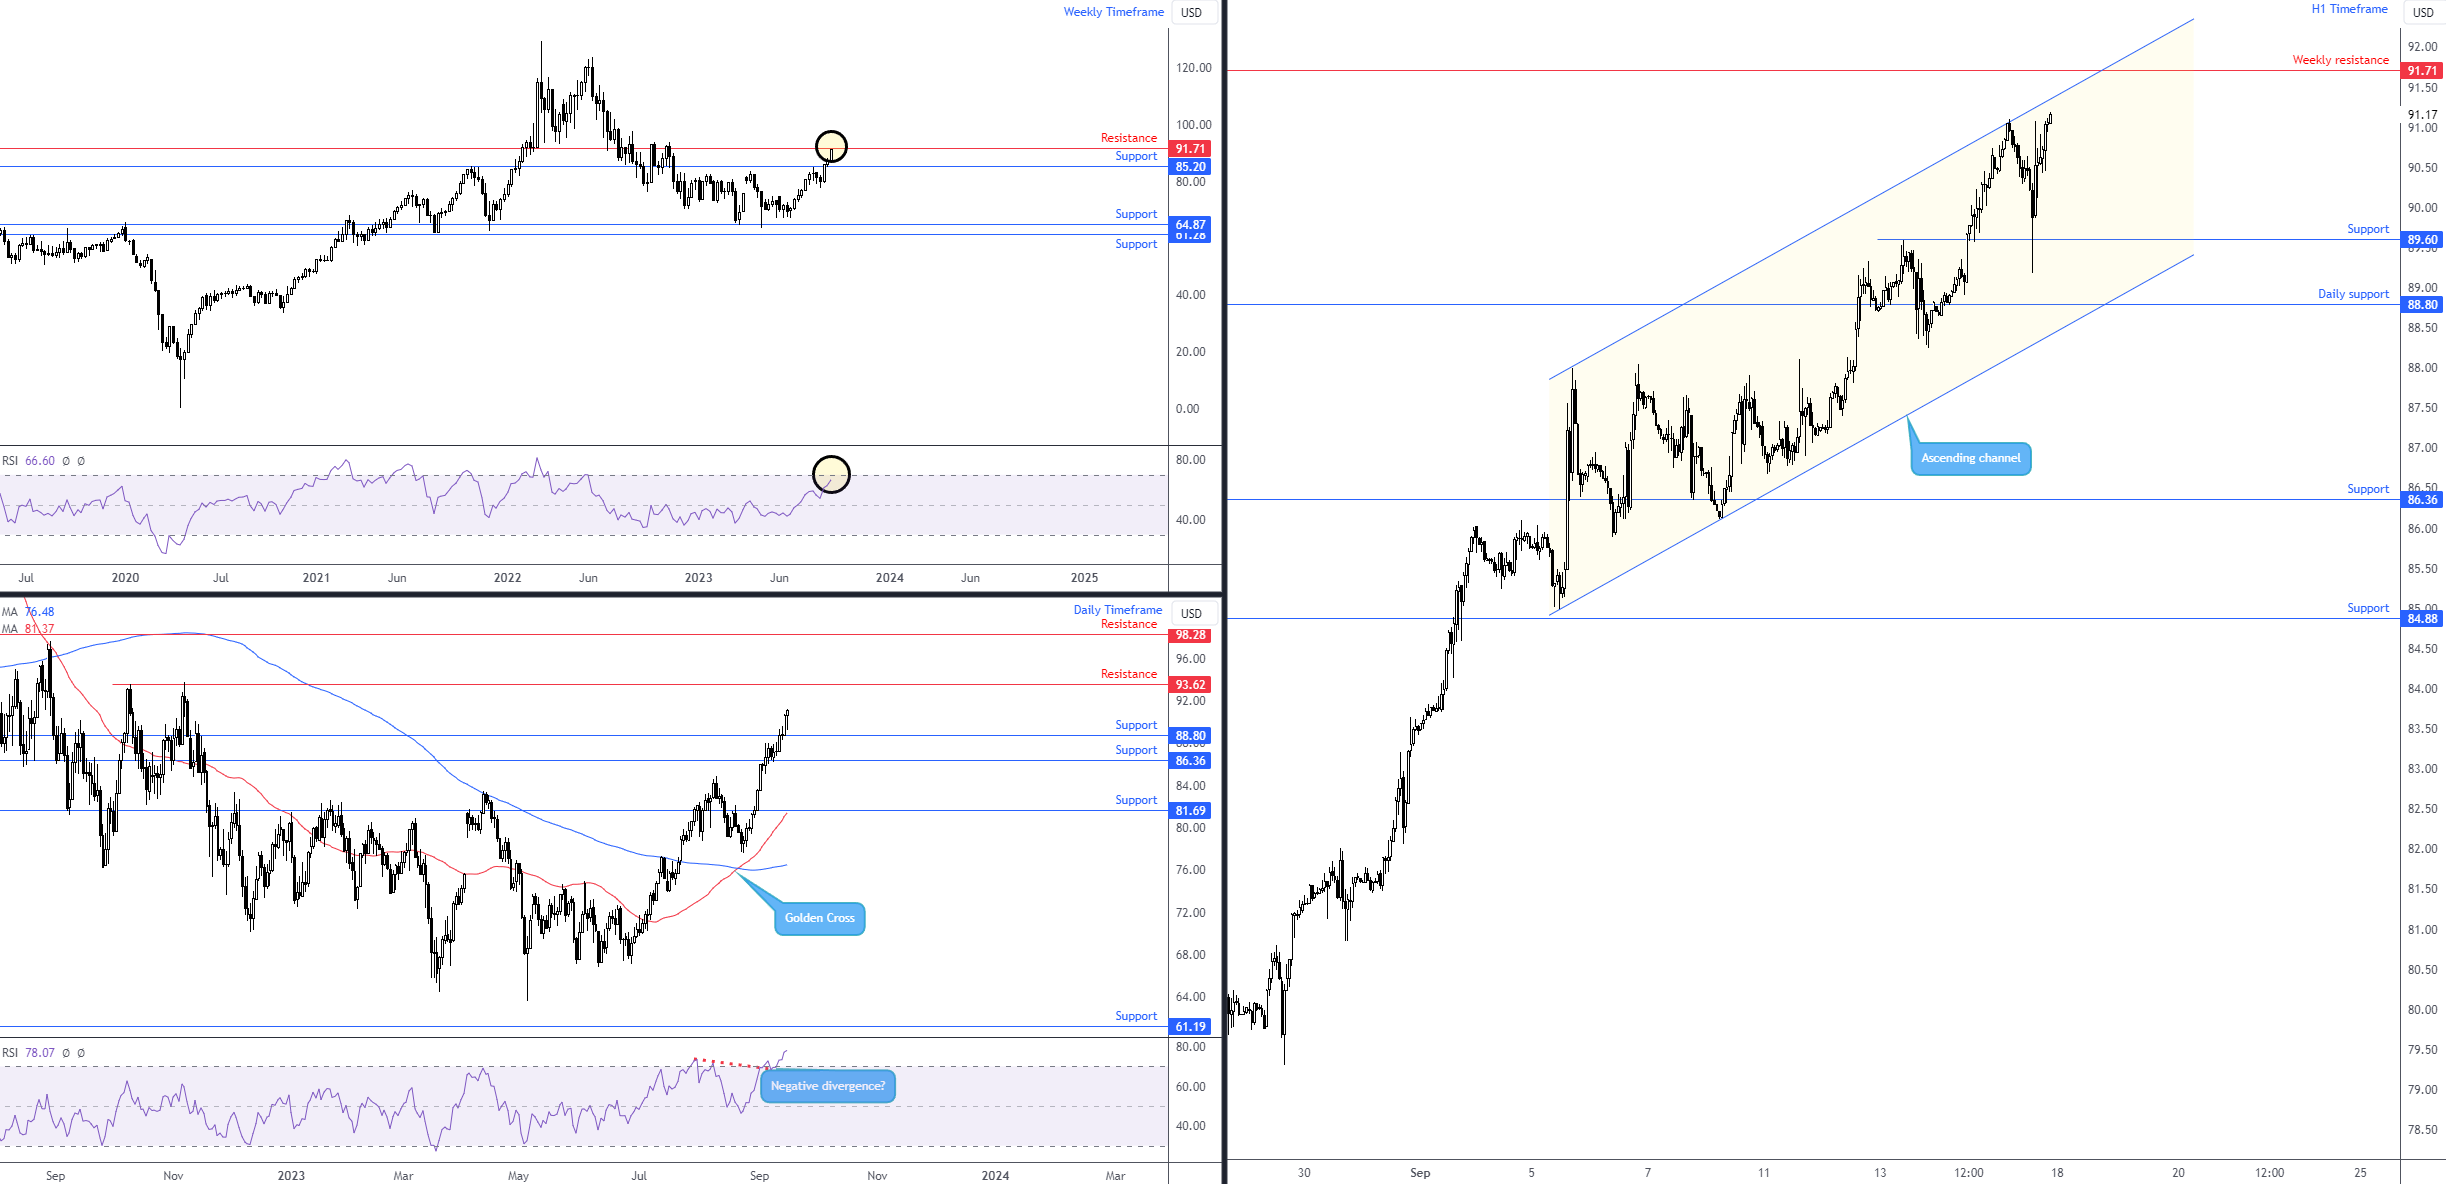
WTI Oil powering higher
The price of WTI oil pencilled in a third consecutive weekly gain, adding +4.6%.
Technical studies show price nearing major resistance at $91.71 on the weekly timeframe, alongside the Relative Strength Index (RSI) also closing in on overbought territory. On the daily timeframe, we can see that price is also comfortably north of support at $88.80, and resistance calls for attention at $93.62—a touch north of the weekly resistance level mentioned above at $91.71. Regarding trend, both timeframes show an upward bias—a series of higher highs and higher lows.
With weekly and daily timeframes showing room to push higher once again until at least weekly resistance at $91.71, traders may seek short-term bullish scenarios this week. However, unless another short-term correction unfolds on the H1 timeframe back to support at $89.60, securing a long entry now appears difficult from a technical perspective unless one is comfortable drilling down to the lower timeframes.
Alternatively, should further buying take the unit above weekly resistance at $91.71 this week, breakout buyers entering the fold is possible, aiming for daily resistance from $93.62.
Charts: TradingView
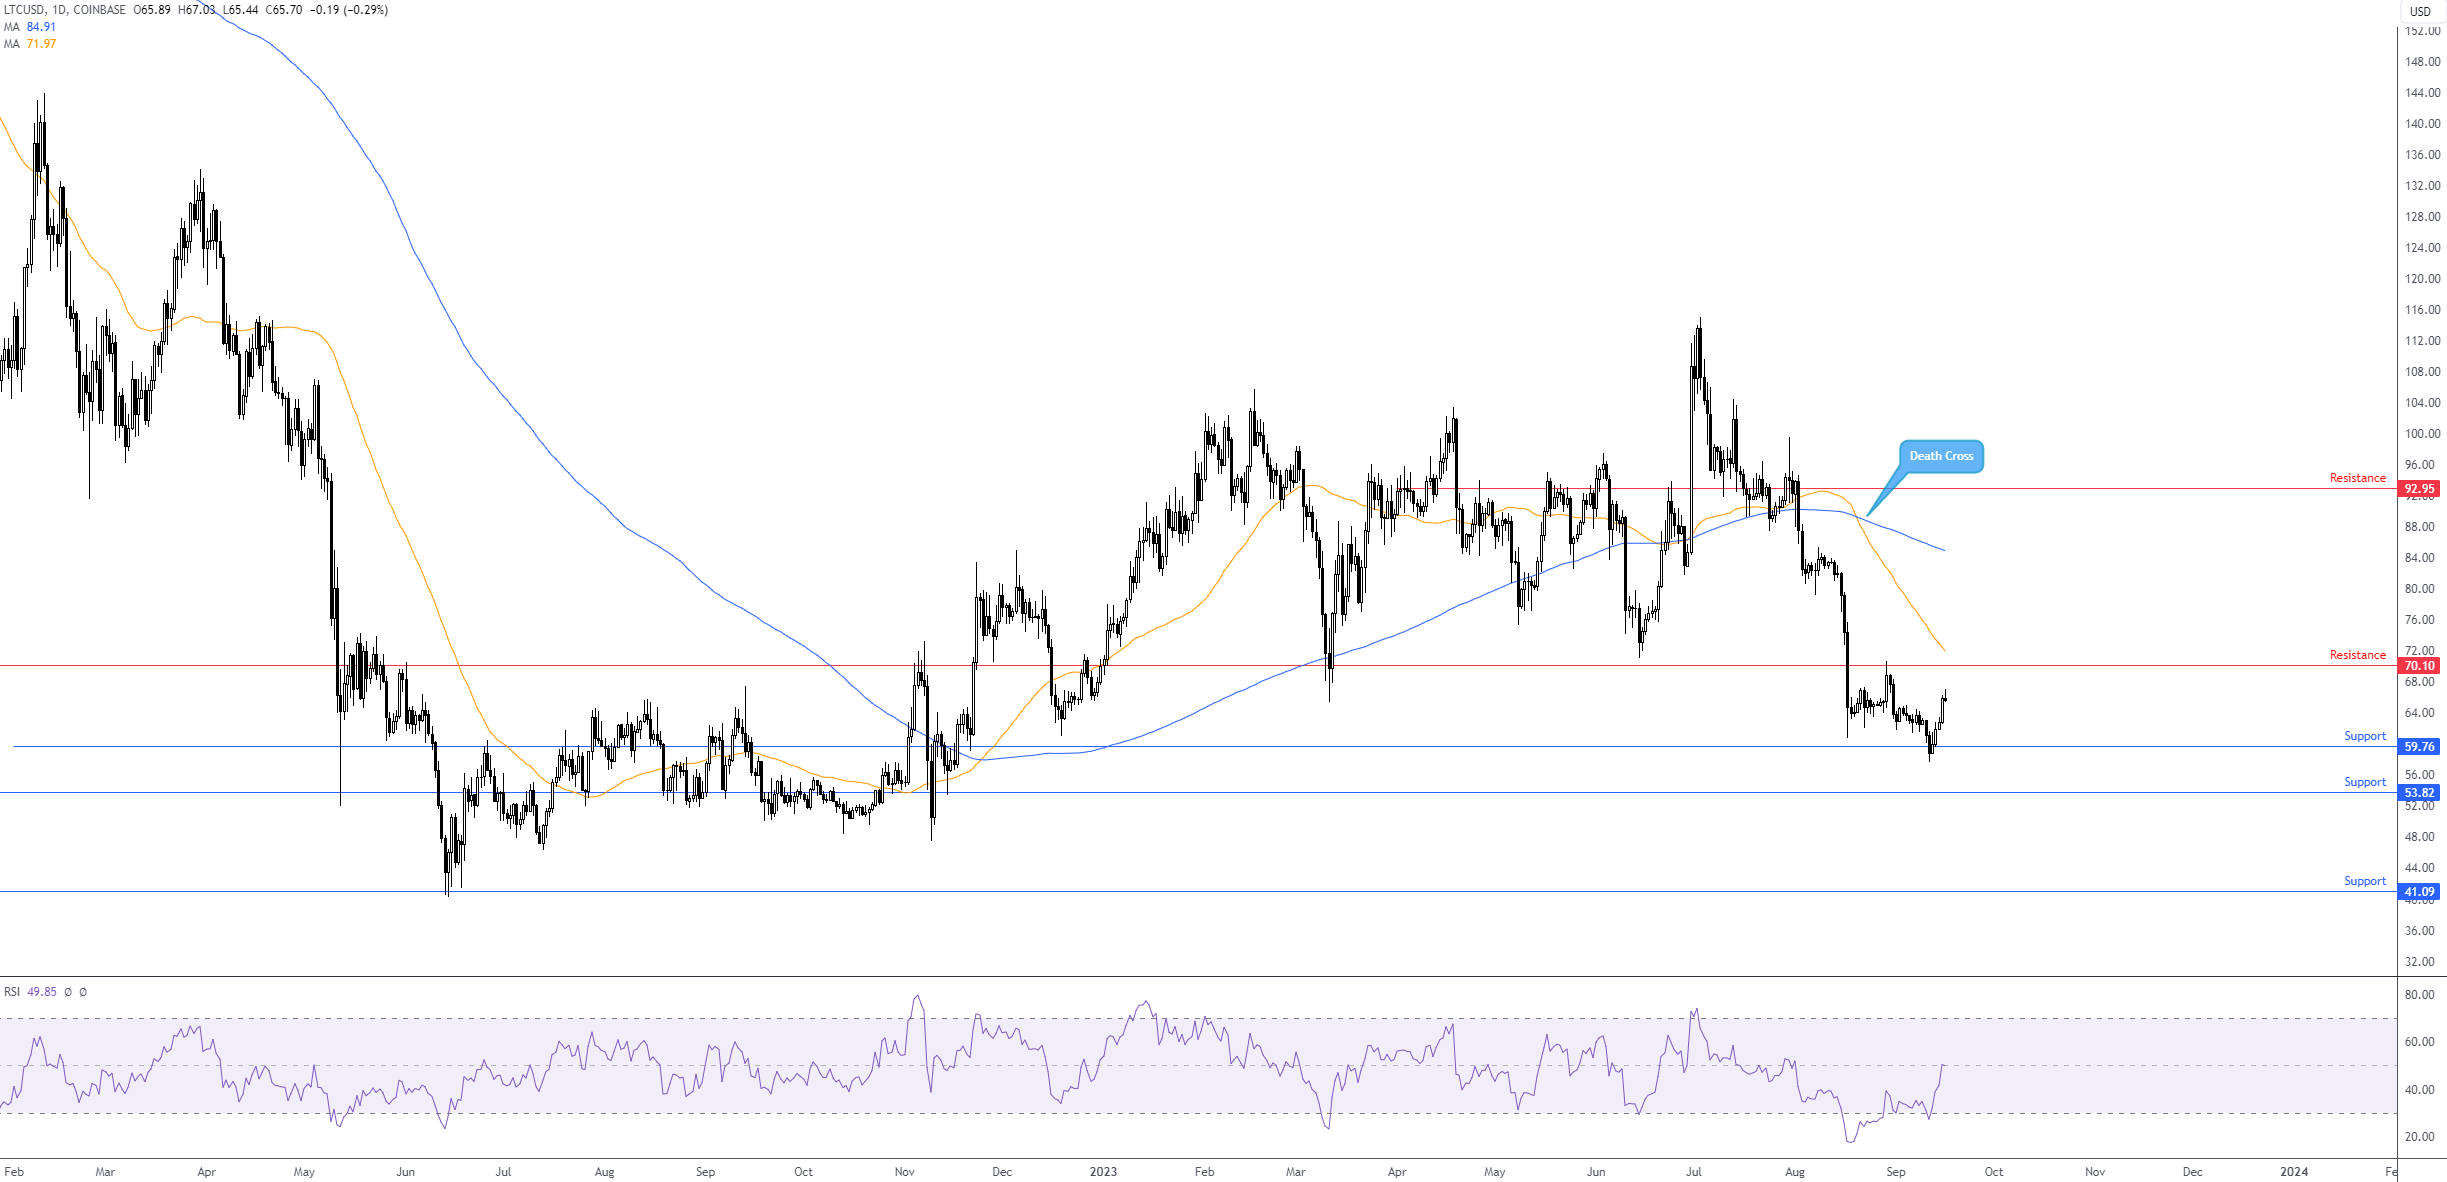
LTC/USD: Sell-on-rally theme?
Following Monday’s decline, the daily price of LTC/USD rebounded from support at $59.76 and rallied into the close on Friday, ending the week higher by +5.7% and snapping a two-week losing streak.
The overall trend has remained south for this major altcoin since topping at $114.98 in early July of this year. Consequently, following a series of lower lows and lower highs and a Death Cross (the 50-day simple moving average [$71.97] crossing under the 200-day simple moving average [$84.91], a move indicating a longer-term bearish trend), the rebound from daily support noted above at $59.76 could be viewed as a potential sell-on-rally opportunity.
Overhead, should further buying emerge, familiar resistance warrants attention at $70.10, a base complemented by the 50-day simple moving average seen nearby. Therefore, if buyers extend the recent pullback, the resistance could be a location that we see sellers make a show from in the coming weeks.
Charts: TradingView
This material on this website is intended for illustrative purposes and general information only. It does not constitute financial advice nor does it take into account your investment objectives, financial situation or particular needs. Commission, interest, platform fees, dividends, variation margin and other fees and charges may apply to financial products or services available from FP Markets. The information in this website has been prepared without taking into account your personal objectives, financial situation or needs. You should consider the information in light of your objectives, financial situation and needs before making any decision about whether to acquire or dispose of any financial product. Contracts for Difference (CFDs) are derivatives and can be risky; losses can exceed your initial payment and you must be able to meet all margin calls as soon as they are made. When trading CFDs you do not own or have any rights to the CFDs underlying assets.
FP Markets recommends that you seek independent advice from an appropriately qualified person before deciding to invest in or dispose of a derivative. A Product Disclosure Statement for each of the financial products is available from FP Markets can be obtained either from this website or on request from our offices and should be considered before entering into transactions with us. First Prudential Markets Pty Ltd (ABN 16 112 600 281, AFS Licence No. 286354).
Recommended Content
Editors’ Picks
EUR/USD stabilizes near 1.0500, looks to post weekly losses

EUR/USD extended its daily decline toward 1.0500 in the second half of the American session, pressured by the souring market mood. Despite the bullish action seen earlier in the week, the pair remains on track to register weekly losses.
GBP/USD falls below 1.2150 as USD rebounds

Following an earlier recovery attempt, GBP/USD turned south and declined below 1.2100 in the second half of the day on Friday. The negative shift seen in risk mood amid rising geopolitical tensions helps the US Dollar outperform its rivals and hurts the pair.
Gold advances to fresh multi-week highs above $1,920

Gold extended its daily rally and climbed above $1,920 for the first time in over two weeks on Friday. Escalating geopolitical tensions ahead of the weekend weigh on T-bond yields and provide a boost to XAU/USD, which remains on track to gain nearly 5% this week.
Bitcoin could be an alternative to US-listed companies but not in the short term

Bitcoin has dipped below $27,000, adding to the subdued cryptocurrency market sentiment. While short-term price concerns persist, analysts predict a rebound based on historical figures.
Nvidia Stock Forecast: NVDA slips as Biden administration attempts to close AI chip loophole

Nvida's stock price opened marginally lower on Friday after Reuters reported that the Biden administration is attempting to close a loophole that allowed Chinese companies access to state-of-the-art computer chips used for AI.