What happened last week?
- The Reserve Bank of Australia (RBA) kept the Official Cash Rate unchanged for a third consecutive meeting at 4.1% as global central banks near their terminal rates. Aussie growth data (GDP) also increased by 0.4% in Q2, a pace matching the previous quarter and largely aligning with economists’ estimates.
- The Bank of Canada (BoC) also kept its Official Overnight Rate unchanged at 5.0%, as widely anticipated by markets and economists. According to the BoC’s accompanying rate statement, the nation is experiencing weaker growth, though the central bank remains open for further rate hikes should inflationary pressures persist. The latest inflation data saw consumer prices rise to 3.3% in the twelve months to July, up from 2.8% in June.
- Over in the States, the ISM Services PMI release recorded a stronger-than-expected print of 54.4 in August, up from 52.7 in July (52.5 expected), marking an eighth consecutive month in expansionary territory for the services PMI. The release triggered a sell-off across major US equity benchmarks and government bonds (underpinning yields) and pulled the dollar to a six-month peak of 105.02 as the odds for a November hike increased to around 60%. The target range probabilities for the Fed rate decision on 20 September, nevertheless, remain largely unmoved following the release, with the market all but fully pricing a no-change (current target rate: 5.25%-5.50%).
- Data from the US on Thursday revealed that the latest number of initial jobless claims declined by 13,000 to 216,000 in the week ending 2 September, marking its lowest level since earlier this year (vs 239,000 expected [229,000 previous]). Continuing claims also fell to 1.679 million in the week ending 26 August, marking a decrease of 40,000 from the previous week’s level of 1.719 million (the lowest level since July). By and large, the latest jobless claims was good news but bad news for monetary policy, showing that the US labour market remains solid even in the face of rate hikes. Although there is week-to-week volatility in the jobless claims measure, it does show some tightness in the jobs market with the recent falls. However, this is unlikely to alter the Fed’s rate decision. We also had a wave of Fed Speak on Thursday, all but confirming that the Fed will hold the line this month.
- Friday welcomed the latest jobs data out of Canada, which comfortably surpassed expectations, adding 39,900 new jobs to the economy in the month of August (vs 18,900 expected [-6,400 previous]), with the unemployment rate remaining steady at 5.5%, which followed three months of consecutive increases from 5.0%. The release weighed on the USD/CAD currency pair, shedding -0.3% to clock a session low of CAD1.3608.
This week…
It is all about US inflation numbers, UK pay data and, of course, the European Central Bank (ECB) rate decision this week.
A week before the Fed’s rate decision (20 September), several US risk events will be on the watchlists for many traders and investors this week, including US CPI and PPI inflation data, industrial production, and retail sales numbers. Of relevance, do also remember that Fed officials will enter the blackout period from 9 September, meaning we’ll be free of Fed speak this week until the rate decision.
The main highlight for the week will be the US CPI release on Wednesday at 12:30 pm GMT. Consumer price inflation is anticipated to rise slightly again in August to 3.6% for the headline print, though economists estimate that a drop in core CPI—excludes food and energy prices—could be seen. From July to August, the MoM reading is expected to jump 0.5%, up from 0.2% the prior month, while the core reading for the same period is forecast to match July at 0.2%.
Across the pond, UK jobs and pay numbers will be widely watched this week on Tuesday morning at 6 am GMT. You will recall that regular pay (excluding bonuses) increased to 7.8% in the three months to June (compared with a year ago), and pay, including bonuses, jumped 8.2% for the same period. For the July release, current forecasts show both releases are expected to match the previous month: 7.8% and 8.2%, respectively. This would likely add pressure on the Bank of England (BoE) to raise rates again this month.
BoE Governor Andrew Bailey also testified to the Treasury Committee last week and communicated that policy is now restrictive, and the central bank is ‘much’ nearer to the top of the policy tightening cycle ‘on the basis of current evidence’.
The BoE rate decision is scheduled on 21 September, and markets are leaning towards another 25bp increase (70% probability as of writing), a move that would pull the Official Bank Rate to 5.5%.
Finally, the ECB rate decision is due on Thursday at 12:15 pm GMT. Markets are pricing about a 60% chance that the central bank will leave all three key benchmark rates unchanged. Needless to say, it is a close call whether they hike or not, but should they indeed go forward with a hike, this, according to many desks, may be the last hike in this cycle; a pause, however, would snap nine consecutive rate hikes.
You may recall that ECB President Christine Lagarde deviated from standard communication in July’s presser and made note that the central bank does not have that much more ground to cover, meaning a pause is certainly on the table, which could further weigh on Europe’s single currency this month.
G10 FX (5-day change):
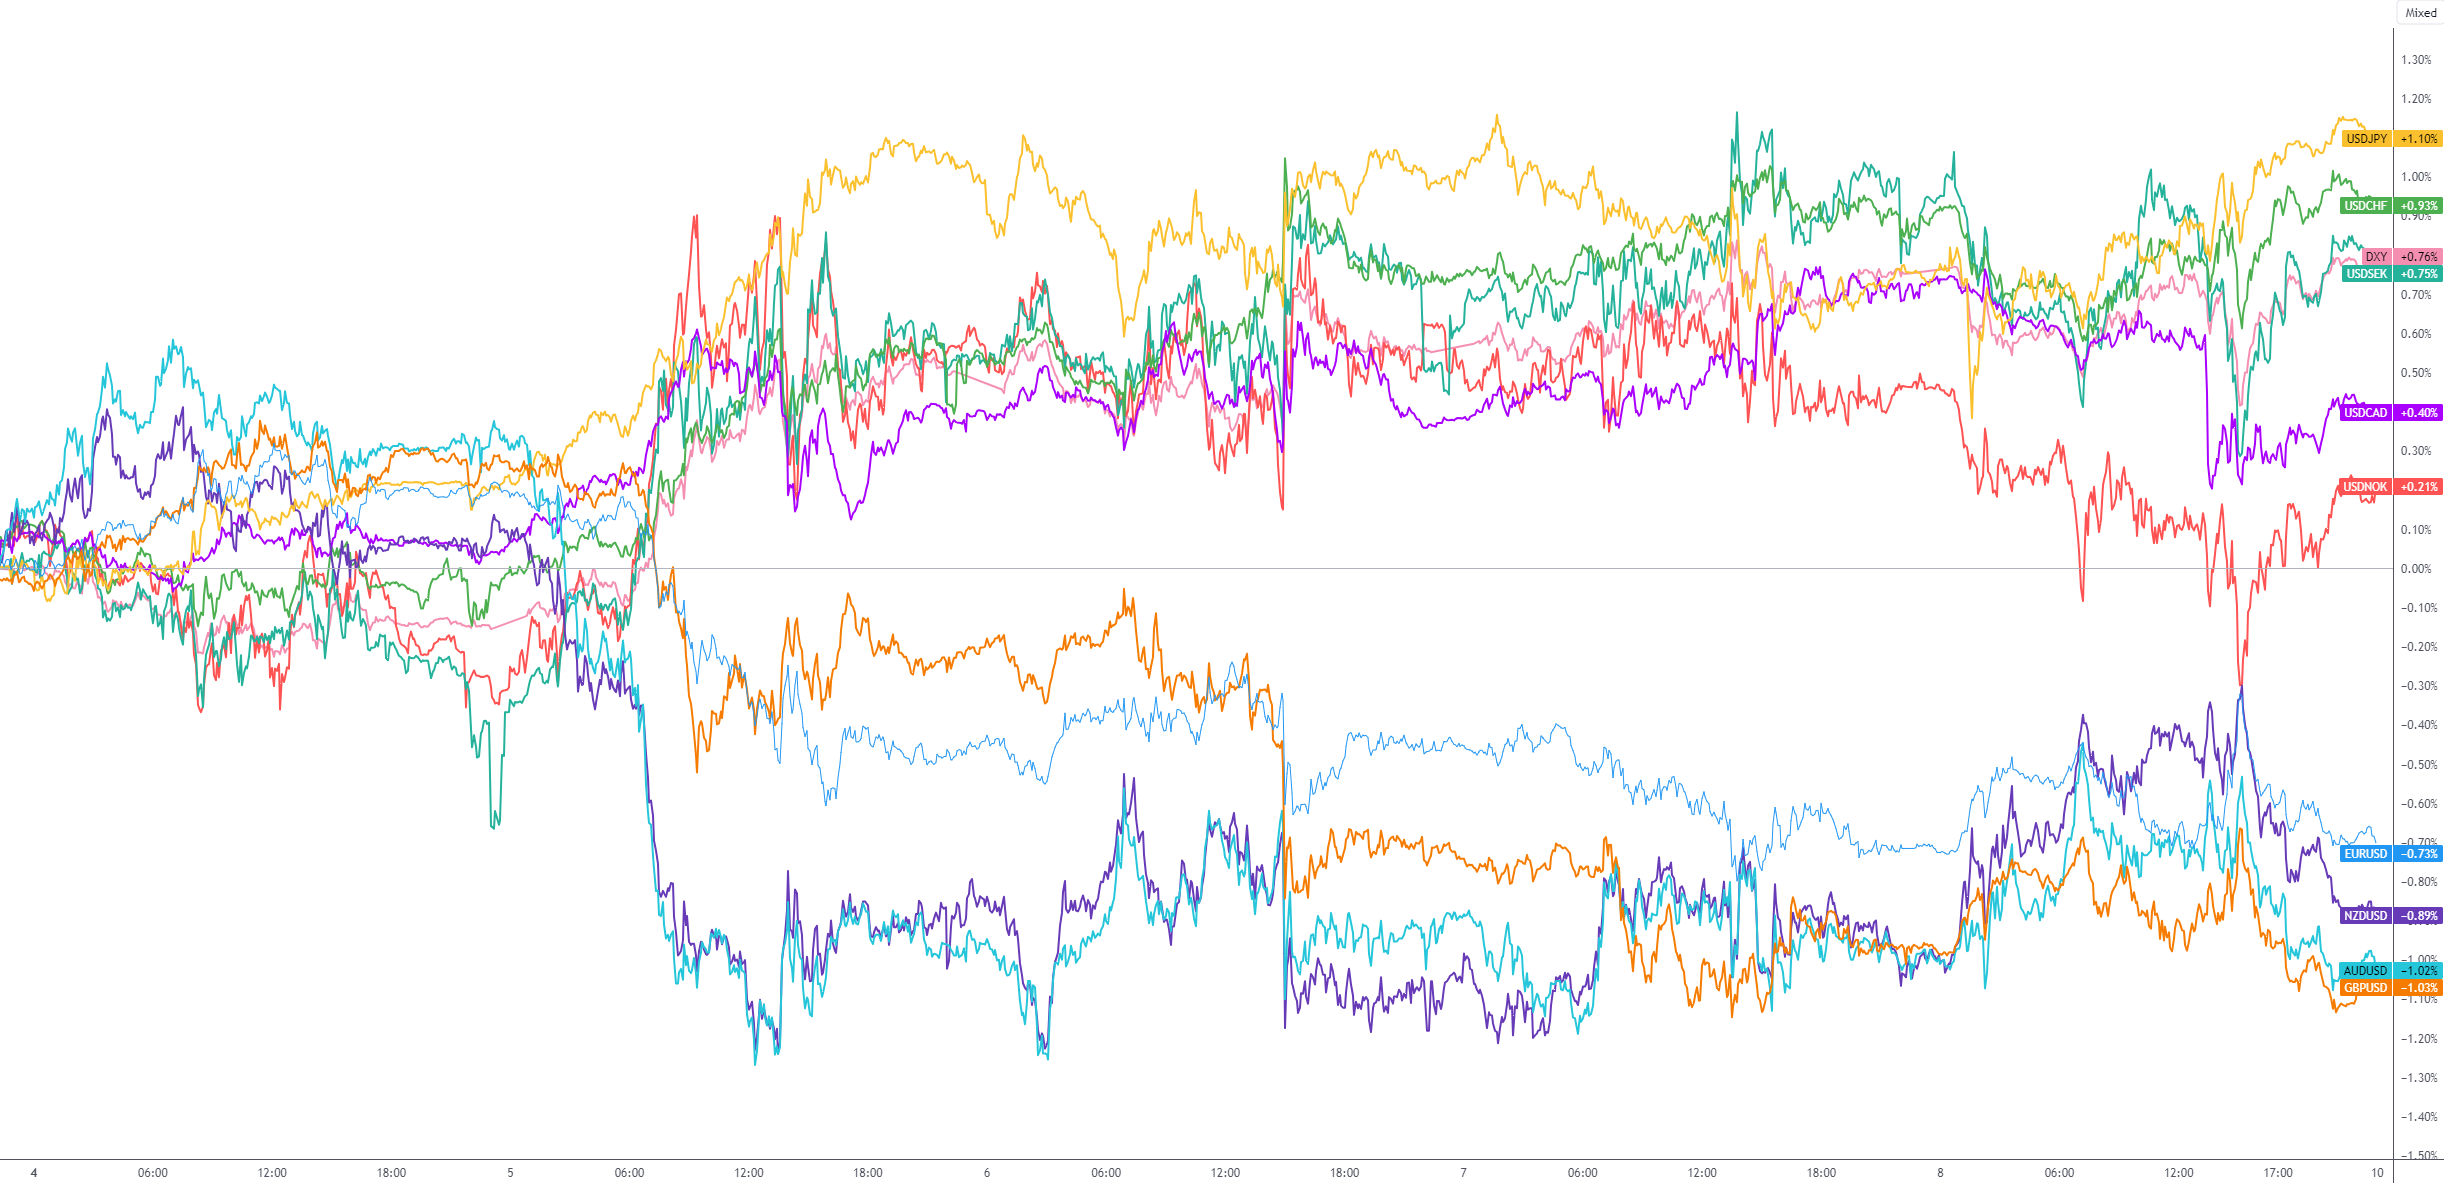
Charts: TradingView
Technical perspective for key markets
Dollar bulls still in the driving seat
The buck finished another week in positive territory last week, adding +0.8% and notching up an eighth consecutive week in the green.
Having noted the rebound from support at 99.67 and the trend facing northbound on the monthly scale in previous writing, as well as the scope for further outperformance in the direction of resistance at 109.33, longer-term chart studies suggest bulls will likely remain in the driving seat for the time being.
As evident from the daily chart, Friday eked out a marginal close north of resistance at 105.04 and left nearby daily support unchallenged at 104.42. With trend studies on the daily timeframe also facing north and price remaining above the 200-day simple moving average at 103.03, this market currently favours technical buying.
Given the analysis, buyers could find acceptance above 105.04 resistance on the daily chart this week and attempt to approach another layer of daily resistance at 105.76.
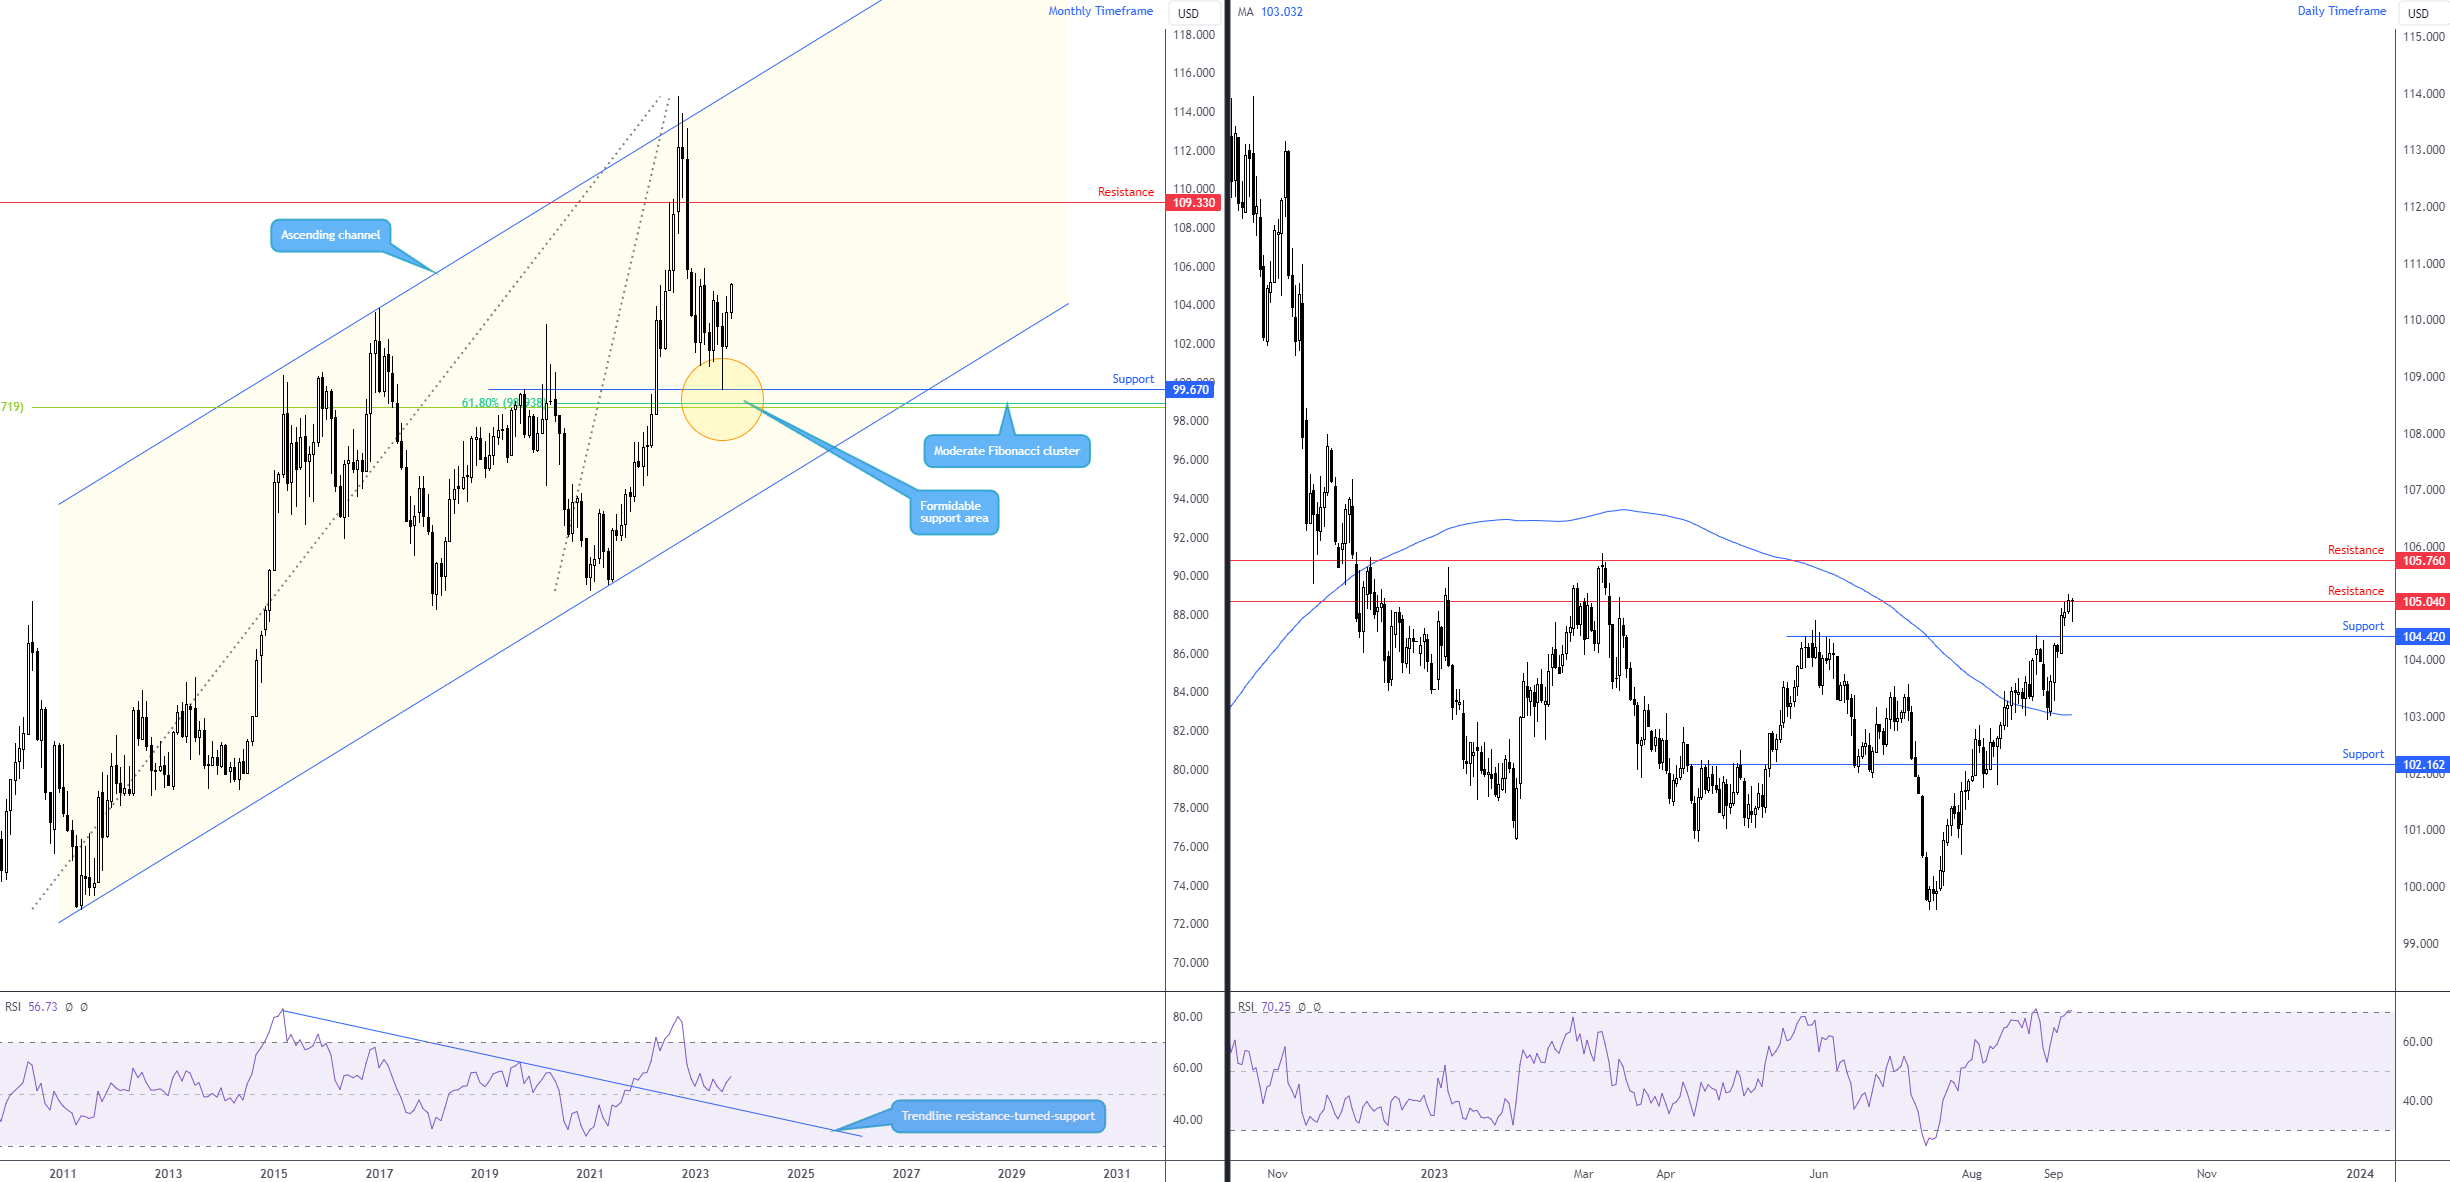
Charts: TradingView
EUR/USD at a crossroads; Daily support breach this week?
Longer-term price action on the monthly timeframe rejected a key area of resistance in July at $1.1233, a base accompanied by the 50-month simple moving average at $1.1165. Subsequent flow observed selling in August, followed by the beginning of September also echoing a bearish vibe, down -1.3% MTD. You will note that the trend on the monthly scale has been lower since 2008, emphasising the pullback from the $0.9536 low (September 2022) and the recent rejection of $1.1233 resistance appears to be enough to attract a sell-on-rally theme in the longer term. The test for sellers will come at monthly support from $1.0516; clearance of this level would help corroborate a downside bias and likely encourage follow-through selling.
But for now, according to the monthly chart, sellers will likely remain in control until at least $1.0516.
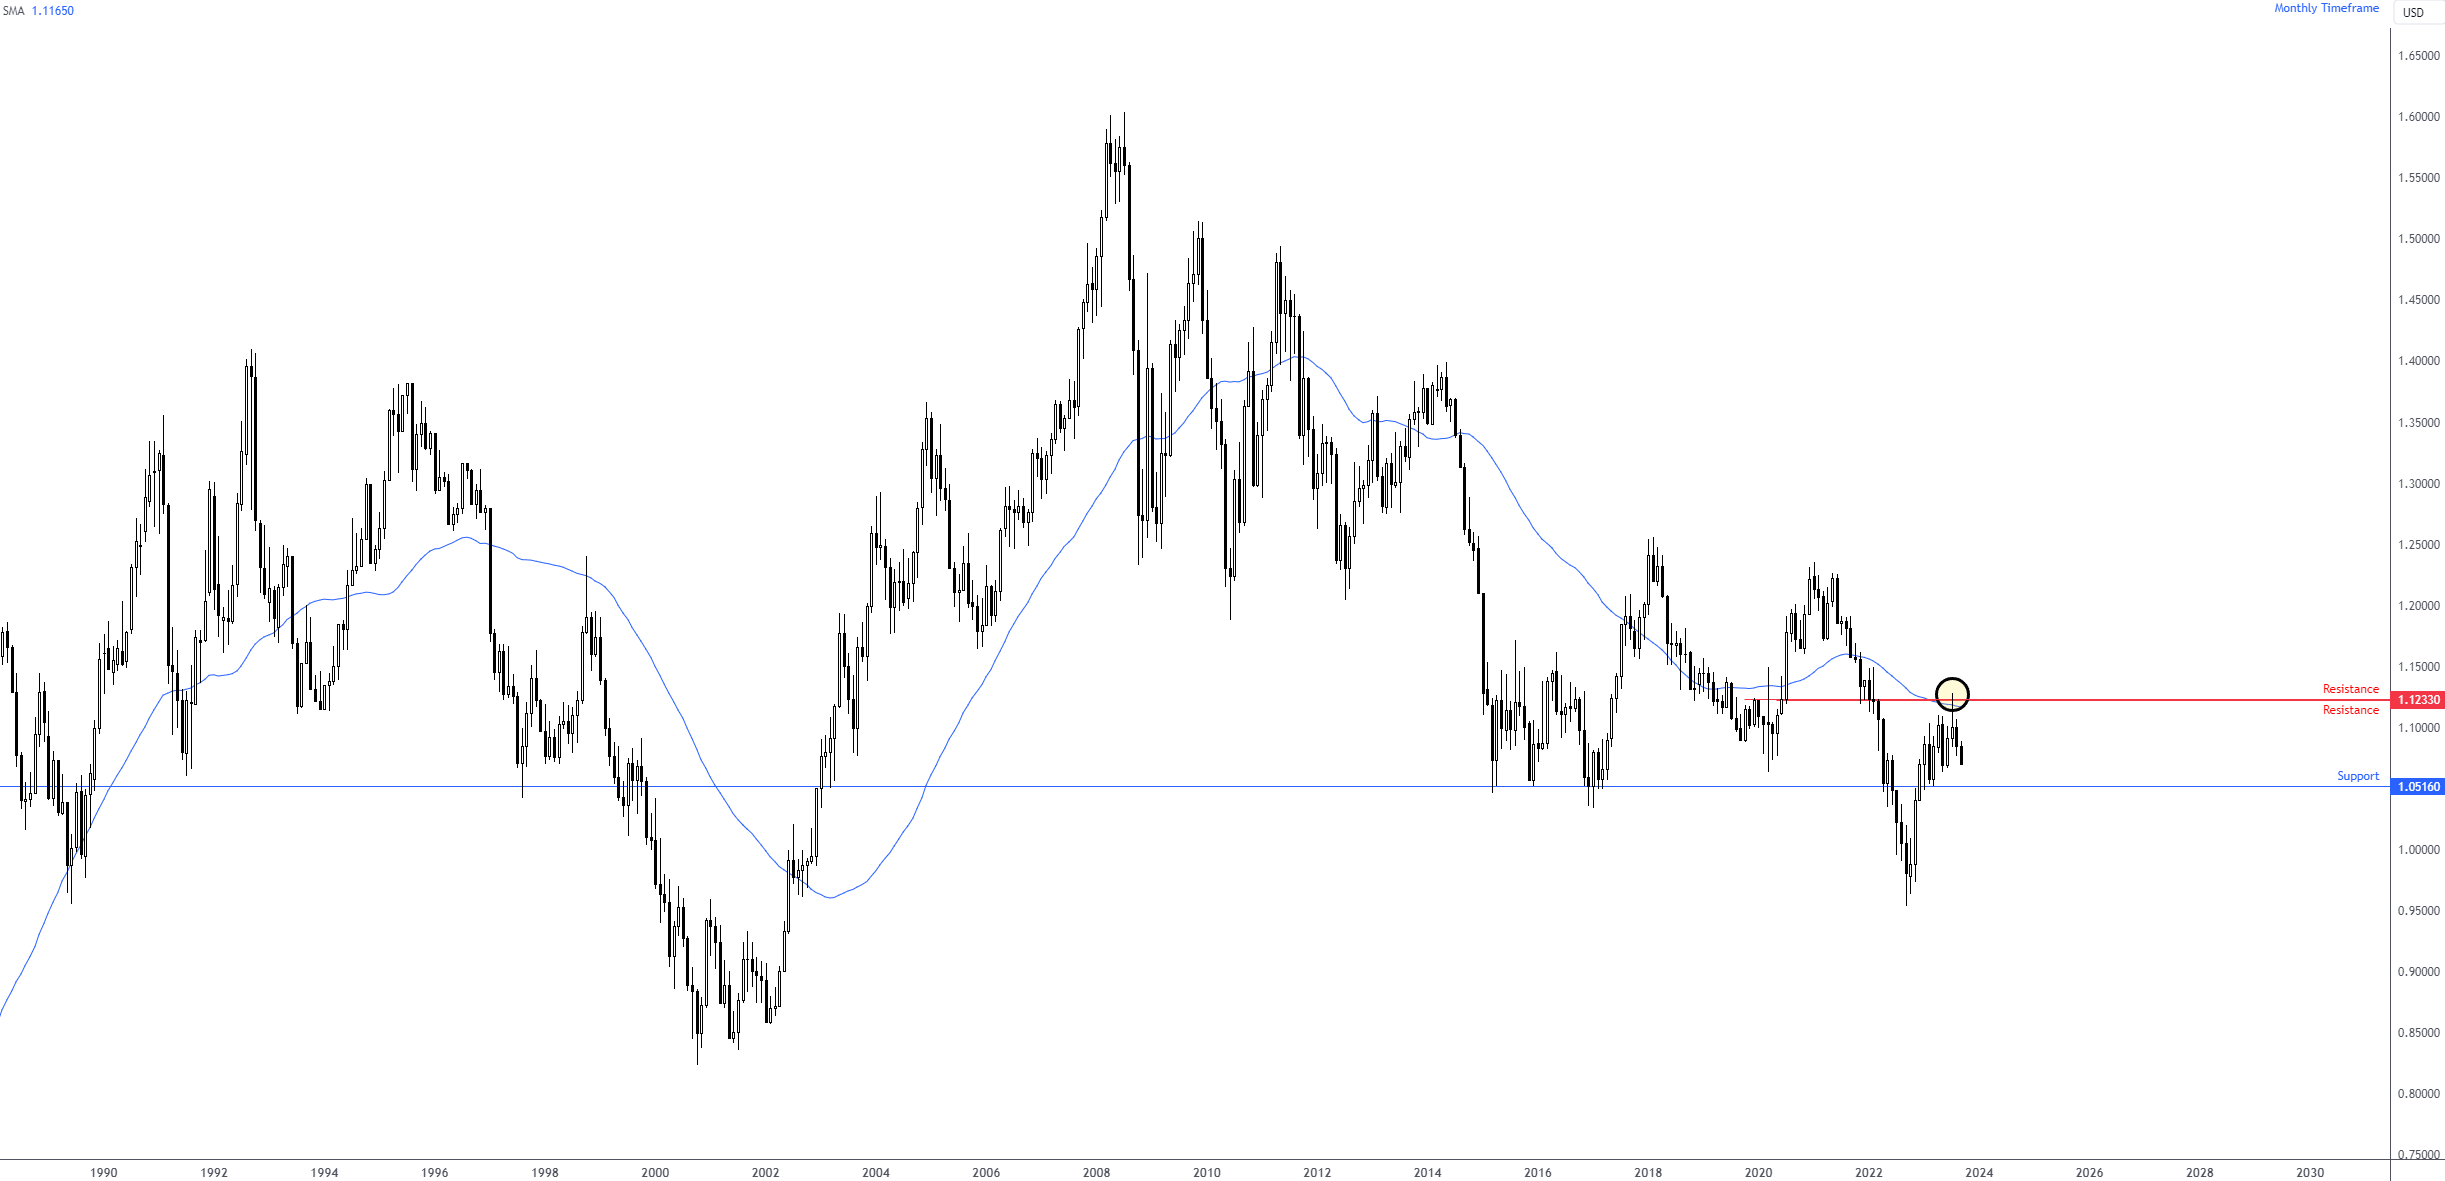
Charts: TradingView
Meanwhile, on the daily chart, support put in an appearance at $1.0689 in the second half of last week and witnessed buyers attempt to make a show on Friday. The bullish presence was nothing to write home about, though should we eventually see additional buying, the 200-day simple moving average at $1.0822 serves as a logical upside target.
Breaching $1.0689 this week, as the monthly timeframe suggests, unfastens the gate for a run to the monthly support level highlighted above at $1.0516 and would, therefore, potentially prompt a bearish play over the coming weeks.
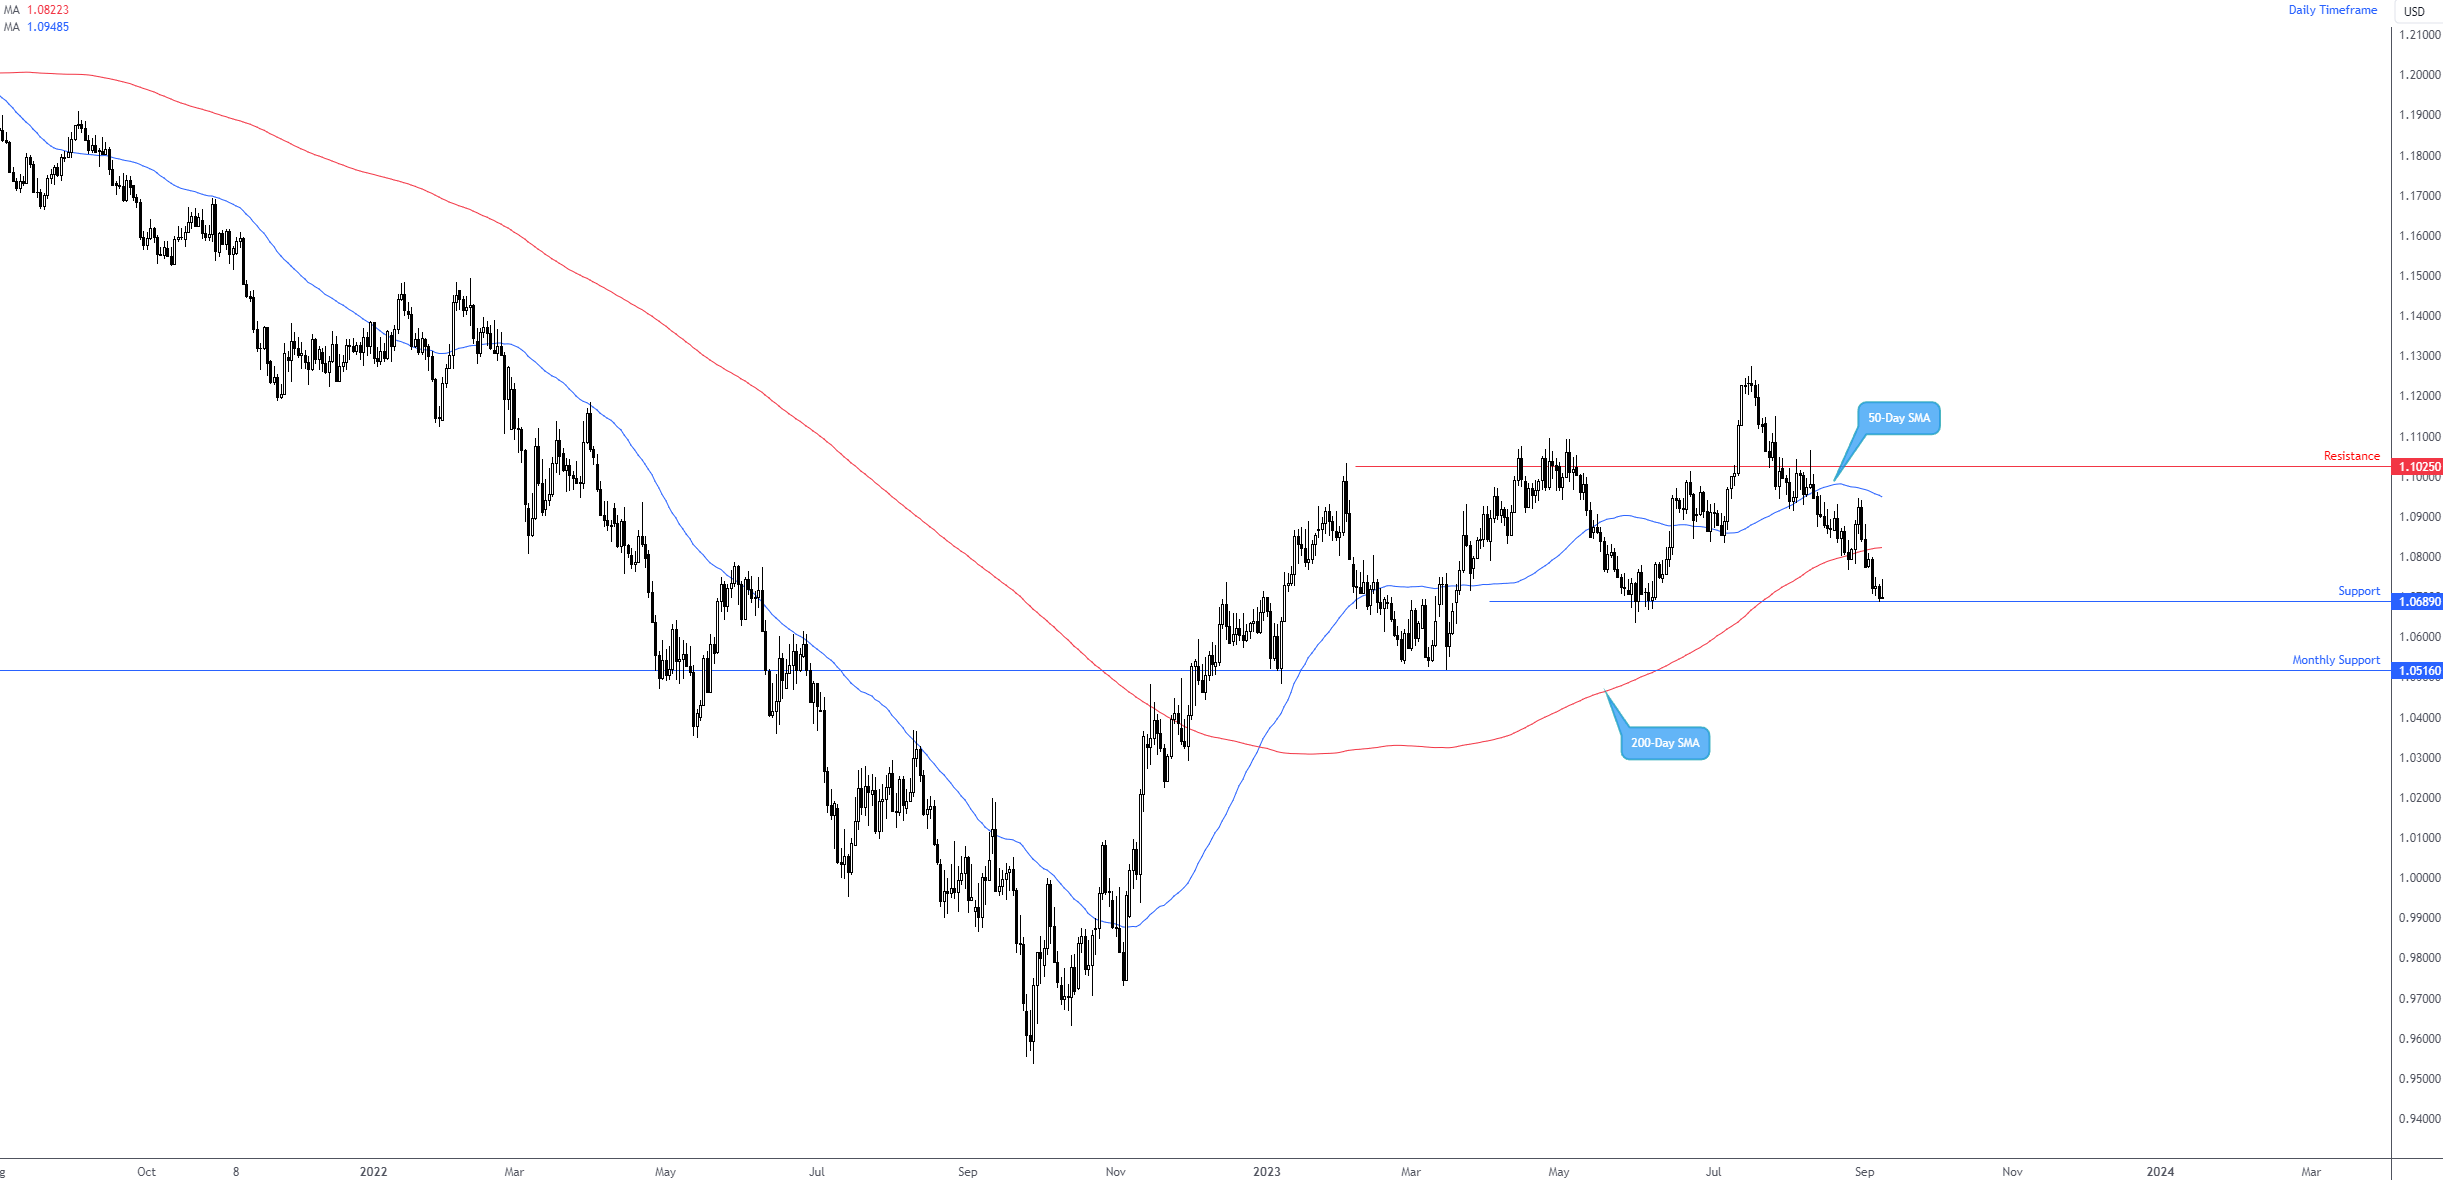
Charts: TradingView
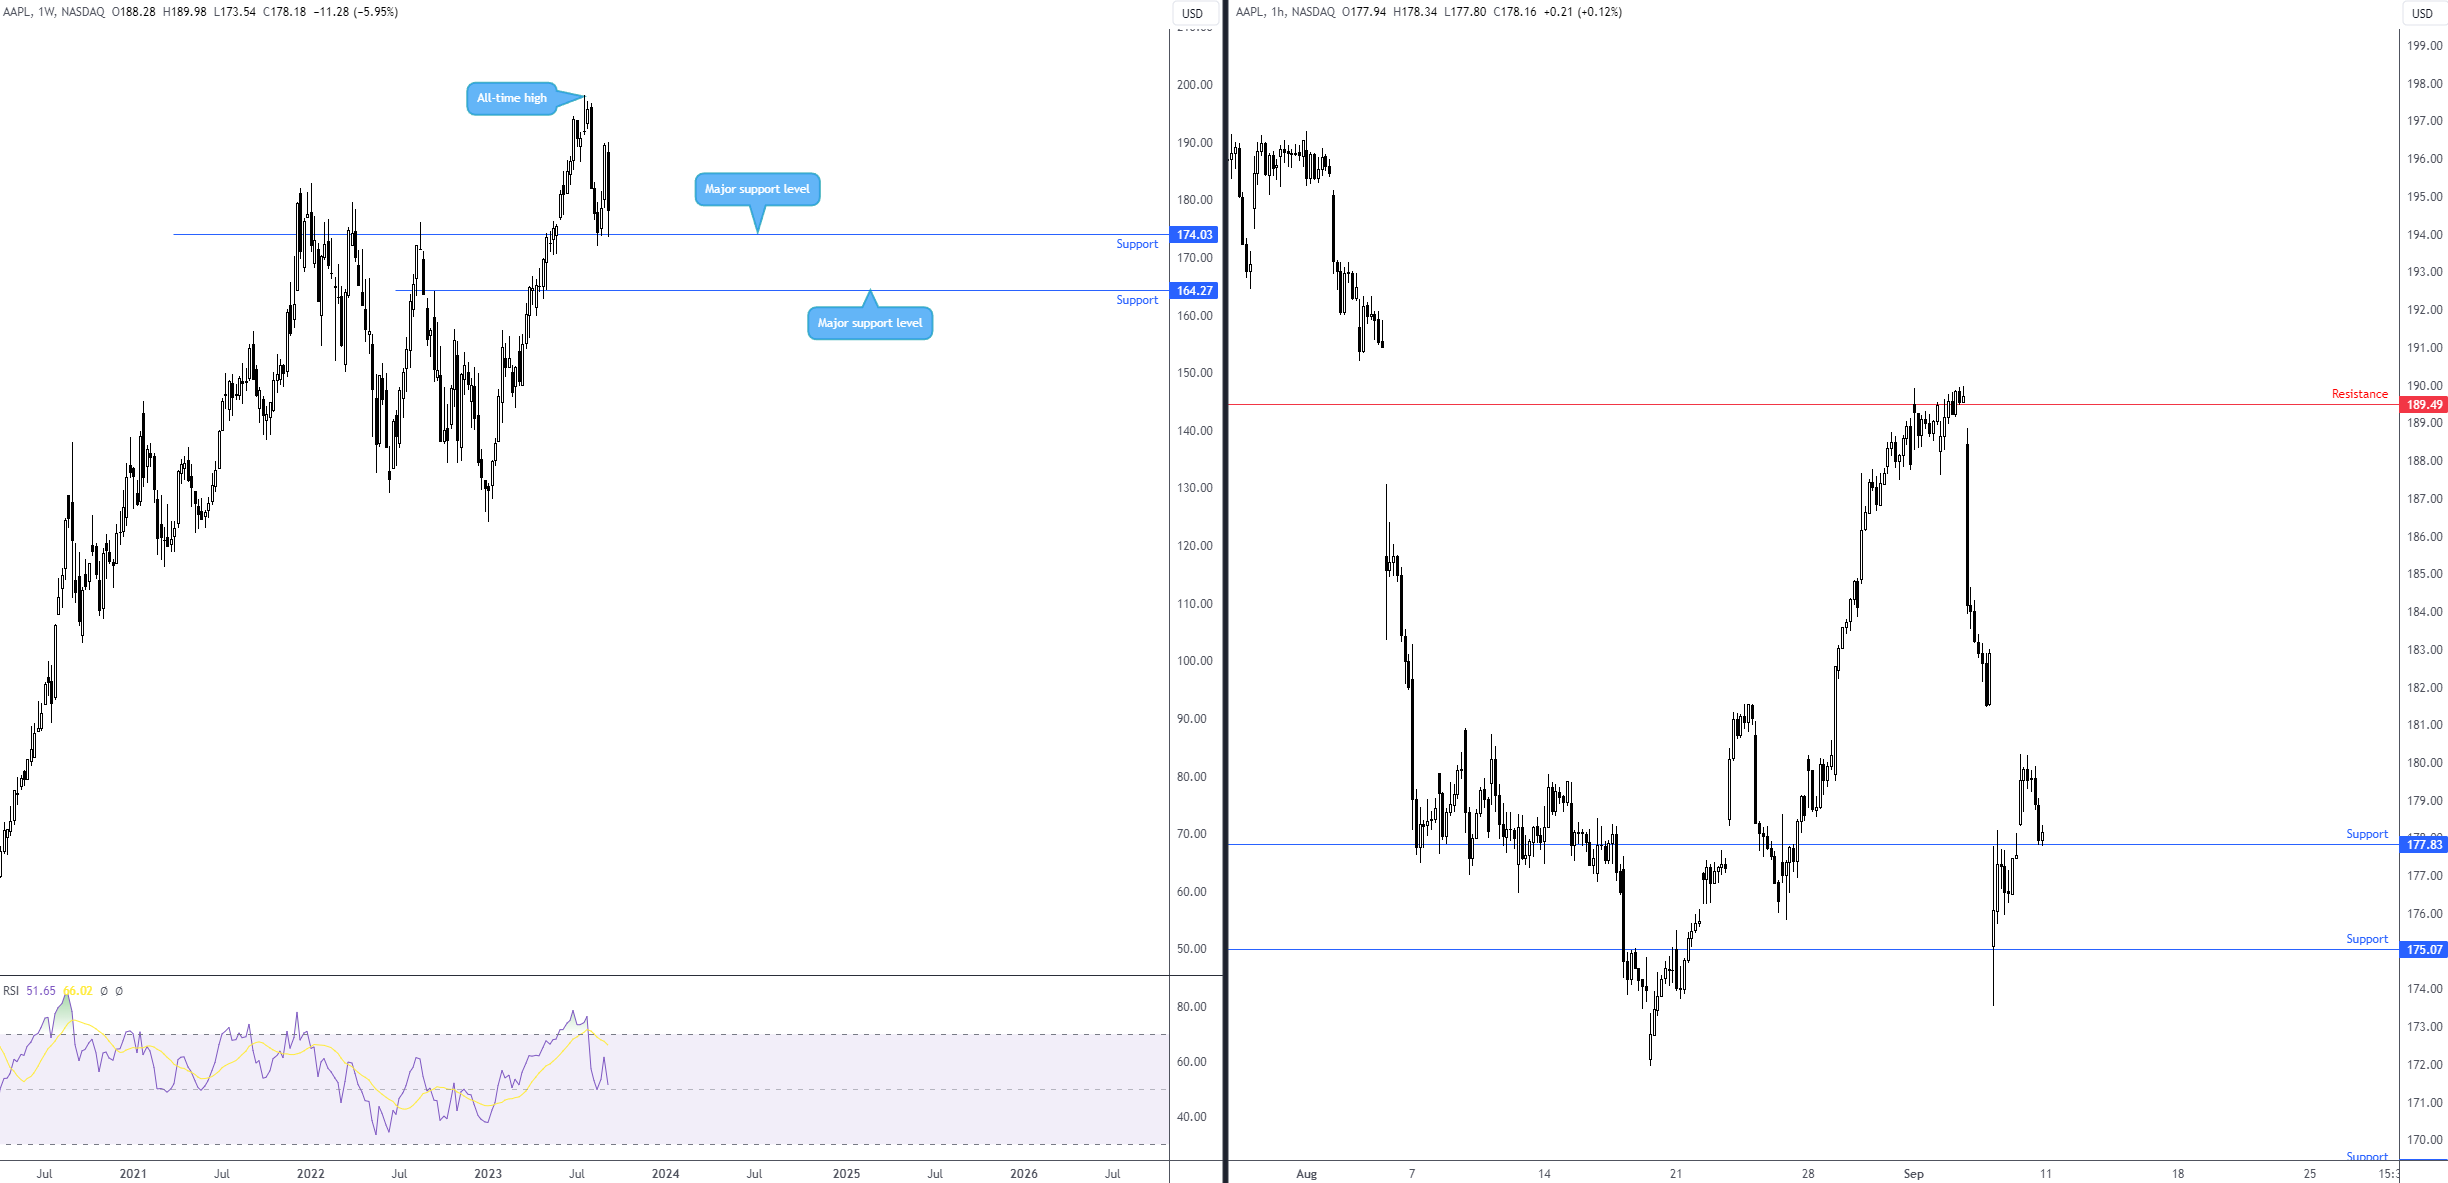
Apple (AAPL) rebounds from familiar weekly support
The sell-off in AAPL shares was well-documented last week. So, it would be remiss not to touch on AAPL this week and where the market is regarding chart structure.
Unless you’ve been hiding under a rock, you’ll have heard of the reports that the Chinese government may ban government employees from bringing their iPhones to work with them. While there has not been an official release from the government relating to the reports, investors were alarmed in recent trading, with the stock plunging –3.6% on Wednesday, followed by a gap lower on Thursday and closing the day down nearly -3.0%. The week ended -6.0% lower and snapped a two-week bullish phase.
The sell-off dragged the share price of AAPL to support at $174.03 on the weekly scale, which provided a technical floor for buyers to work with in the second half of last week. With the weekly timeframe’s Relative Strength Index (RSI) maintaining position north of the 50.00 centreline (positive momentum), $174.03 could remain in play this week. Nevertheless, in the event of a breach lower in the coming weeks, weekly support calls for attention at $164.27.
Elsewhere, on the H1 timeframe, we can see that the week ended with the stock retesting short-term support from $177.83 after partially filling Thursday’s downside gap (window). We could, therefore, see buyers emerge at $177.83 in early trading this week, targeting the upper edge of the gap around $181.54, with a break north of here throwing light on resistance as far north as $189.49. Notably, a push higher aligns with not only the weekly timeframe’s uptrend but also last week’s rebound from weekly support ($174.03).
Charts: TradingView
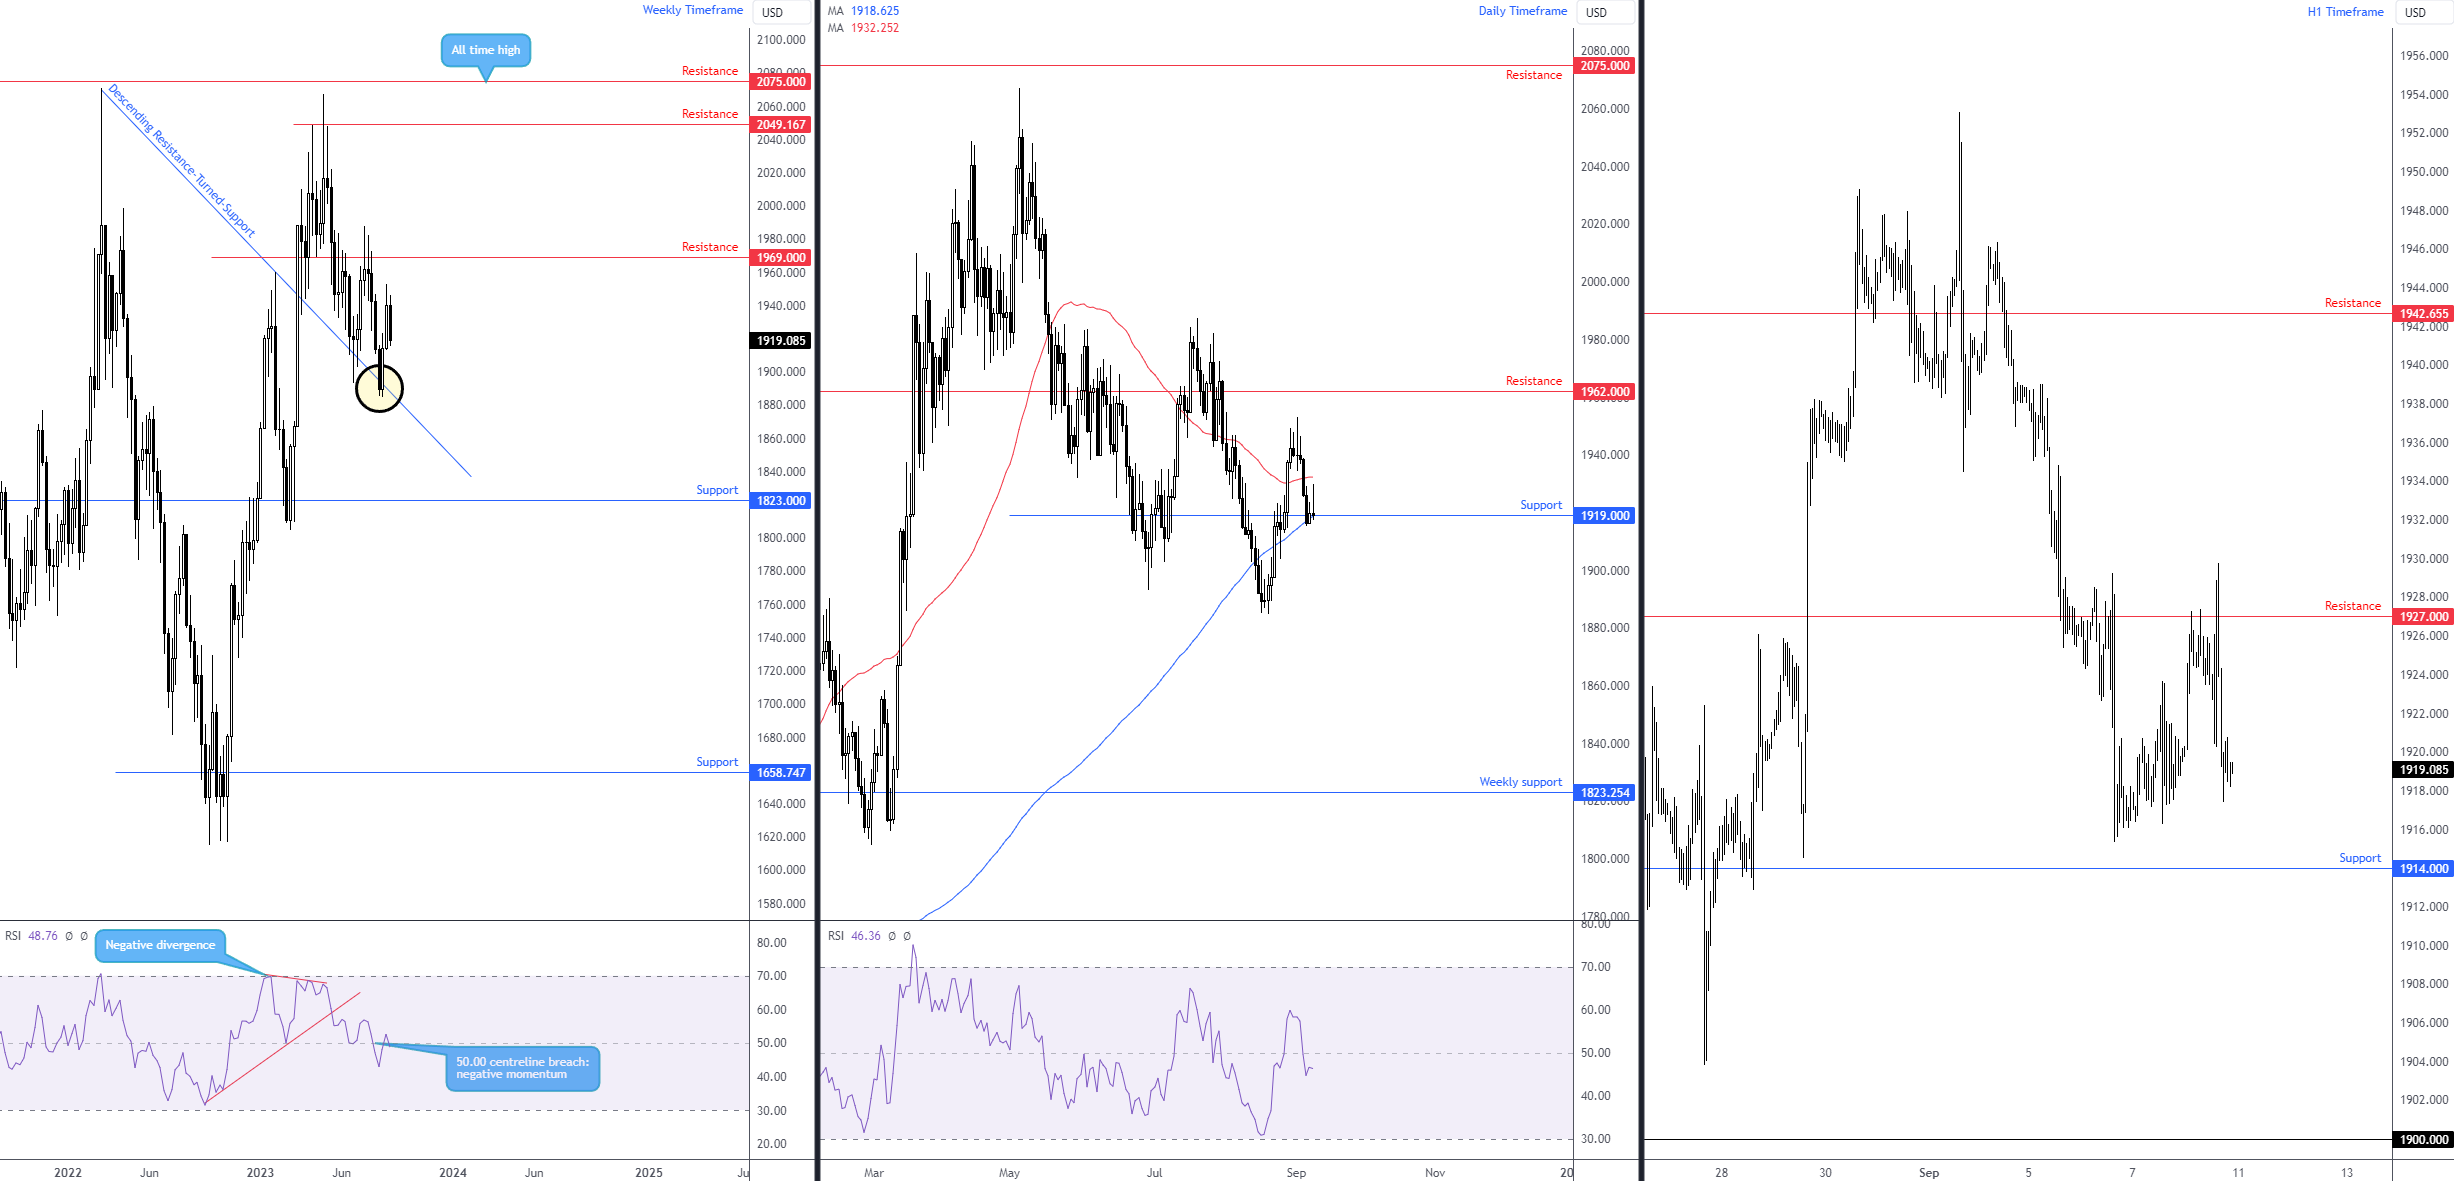
XAU/USD displaying scope to explore lower levels
Spot gold in $ terms withdrew last week, erasing -1.1% and trimming a large portion of the previous two-week winning streak that began from the weekly timeframe’s descending resistance-turned support taken from the high of $2,070. Leaving weekly resistance unchallenged at $1,969, further selling in this market in the medium term could see the yellow metal retest the spirit of the aforesaid descending support and maybe, with a little oomph, weekly support coming in at $1,823.
The weekly and daily timeframes are now exhibiting downtrends, according to price structure. With the 50-day simple moving average at $1,932 nearing the 200-day simple moving average at $1,918, we might also eventually observe what’s referred to as a Death Cross (the 50-day SMA crossing below the 200-day SMA), signalling that a longer-term bearish trend may be in the pipeline.
Price action on the daily timeframe ended the week testing the grip of the aforementioned 200-day SMA, joined by horizontal support from $1,919. Having seen the 50-day SMA circling just overhead and Friday concluding considerably off best levels, price crossing under the 200-day SMA this week would be viewed as a bearish trend reversal signal. And aside from the $1,884 low formed on 21 August, possibly offering a technical floor, the ground below $1,919 appears thin until the weekly timeframe’s support noted above at $1,823.
On the H1 timeframe, Friday retested resistance at $1,927 and has room to nudge lower in the short term to test support at $1,914. Ultimately, knowing that there’s room to move lower on the weekly timeframe, and daily support from $1,919 appears vulnerable (along with the 200-day SMA), short-term traders will likely be expecting the yellow metal to continue lower and test $1,914 on the H1. However, for additional sellers to commit this week, a H1 close under $1,914 is likely needed, potentially exposing $1,900 as the next downside objective.
Charts: TradingView
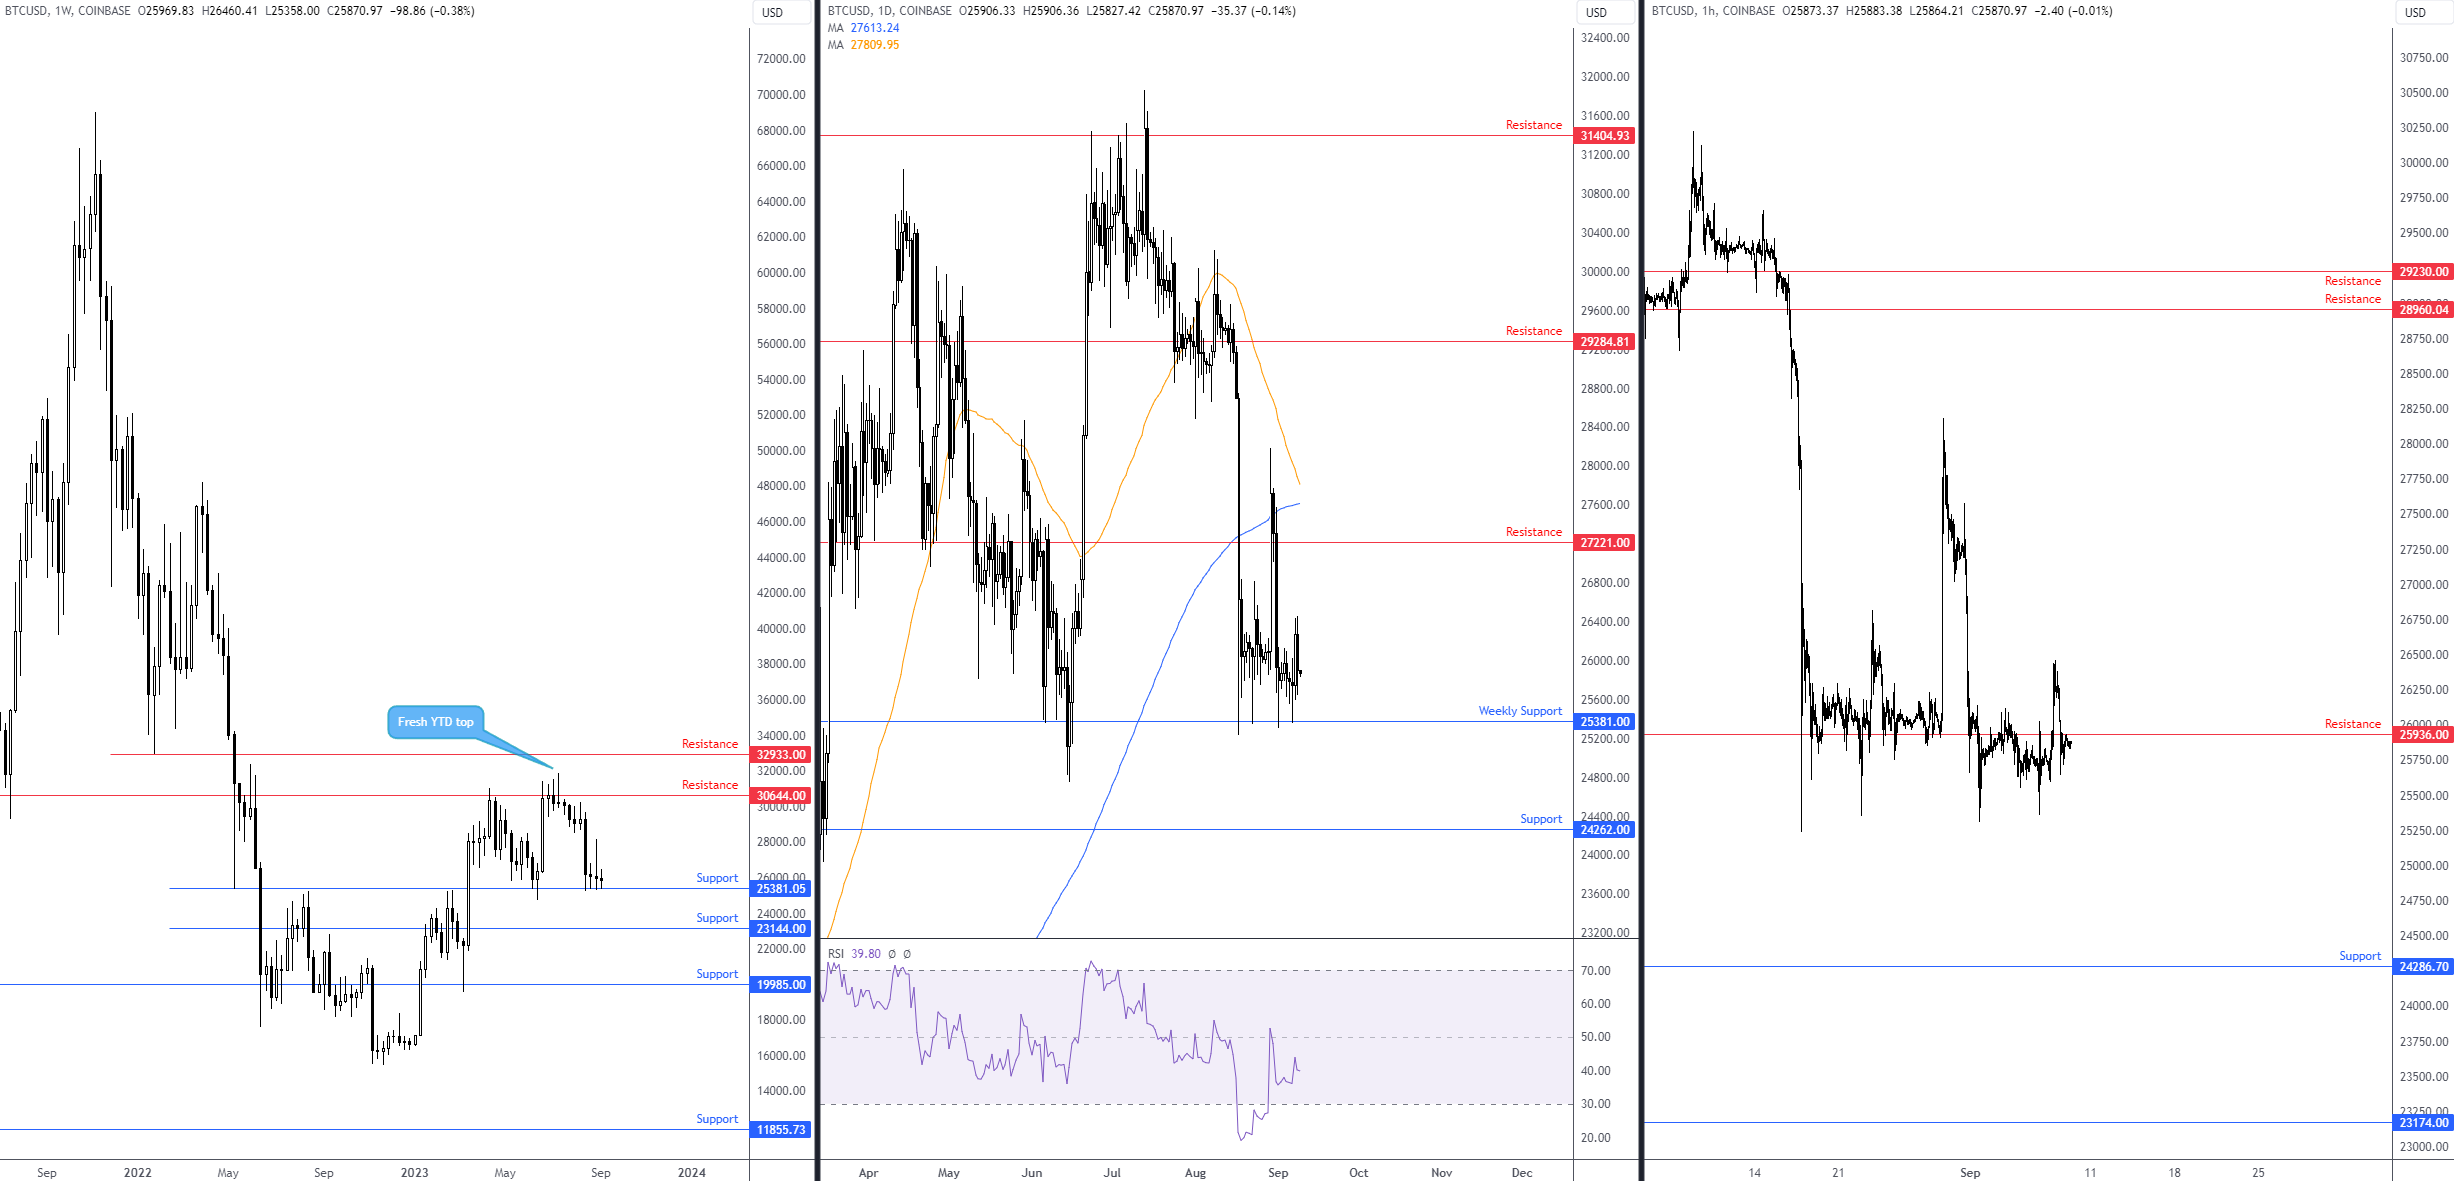
BTC/USD: Weekly support remains vulnerable
Against the US dollar, the price of Bitcoin wrapped up the week unmoved and shaped a doji indecision candle on the weekly timeframe. This marks the major cryptocurrency’s third successive doji indecision candle at support on the weekly chart from $25,381.
Given the lack of volatility over the last couple of weeks, much of the following analysis will echo thoughts presented in previous analysis (italics):
The test of weekly support follows a rejection from weekly resistance overhead at $30,644. The key observation for me this week is the weekly support level at $25,381; rupturing this base unearths weekly support from $23,144, followed by another layer of support at $19,985. Technically speaking, the risk of further declines is possible above $25,381, considering the feeble buying so far. Assuming sellers do indeed make a push, this could also see the beginnings of an early trend reversal unfold if we nudge beneath the $24,750 low (the most recent higher low formed on 15 June).
You will note that on the daily timeframe, price recently connected with resistance at $27,221, a level accompanied by the widely watched 200-day simple moving average (often serving as dynamic support and resistance), currently at $27,613. The combination of this technical resistance was evidently sufficient for technical sellers to put in an appearance and cap buying off the weekly support highlighted above at $25,381. This—coupled with the Relative Strength Index (RSI) recoiling from the lower side of the 50.00 centreline (negative momentum)—places a bold question mark on the weekly support this week and throws light on daily support at $24,262.
As we move to the H1 timeframe, $25,936 is a key short-term level. You will note that the level has withstood several upside attempts this month—one particularly stood out last week, reaching a high of $26,460. Sellers continuing to defend the H1 resistance signals a willingness to challenge the position of weekly support at $25,381. Interestingly, limited support is seen on the H1 chart until as far south as $24,286, indicating that price could eventually tunnel through $25,381 in the following weeks and present a bearish theme to work with.
Charts: TradingView
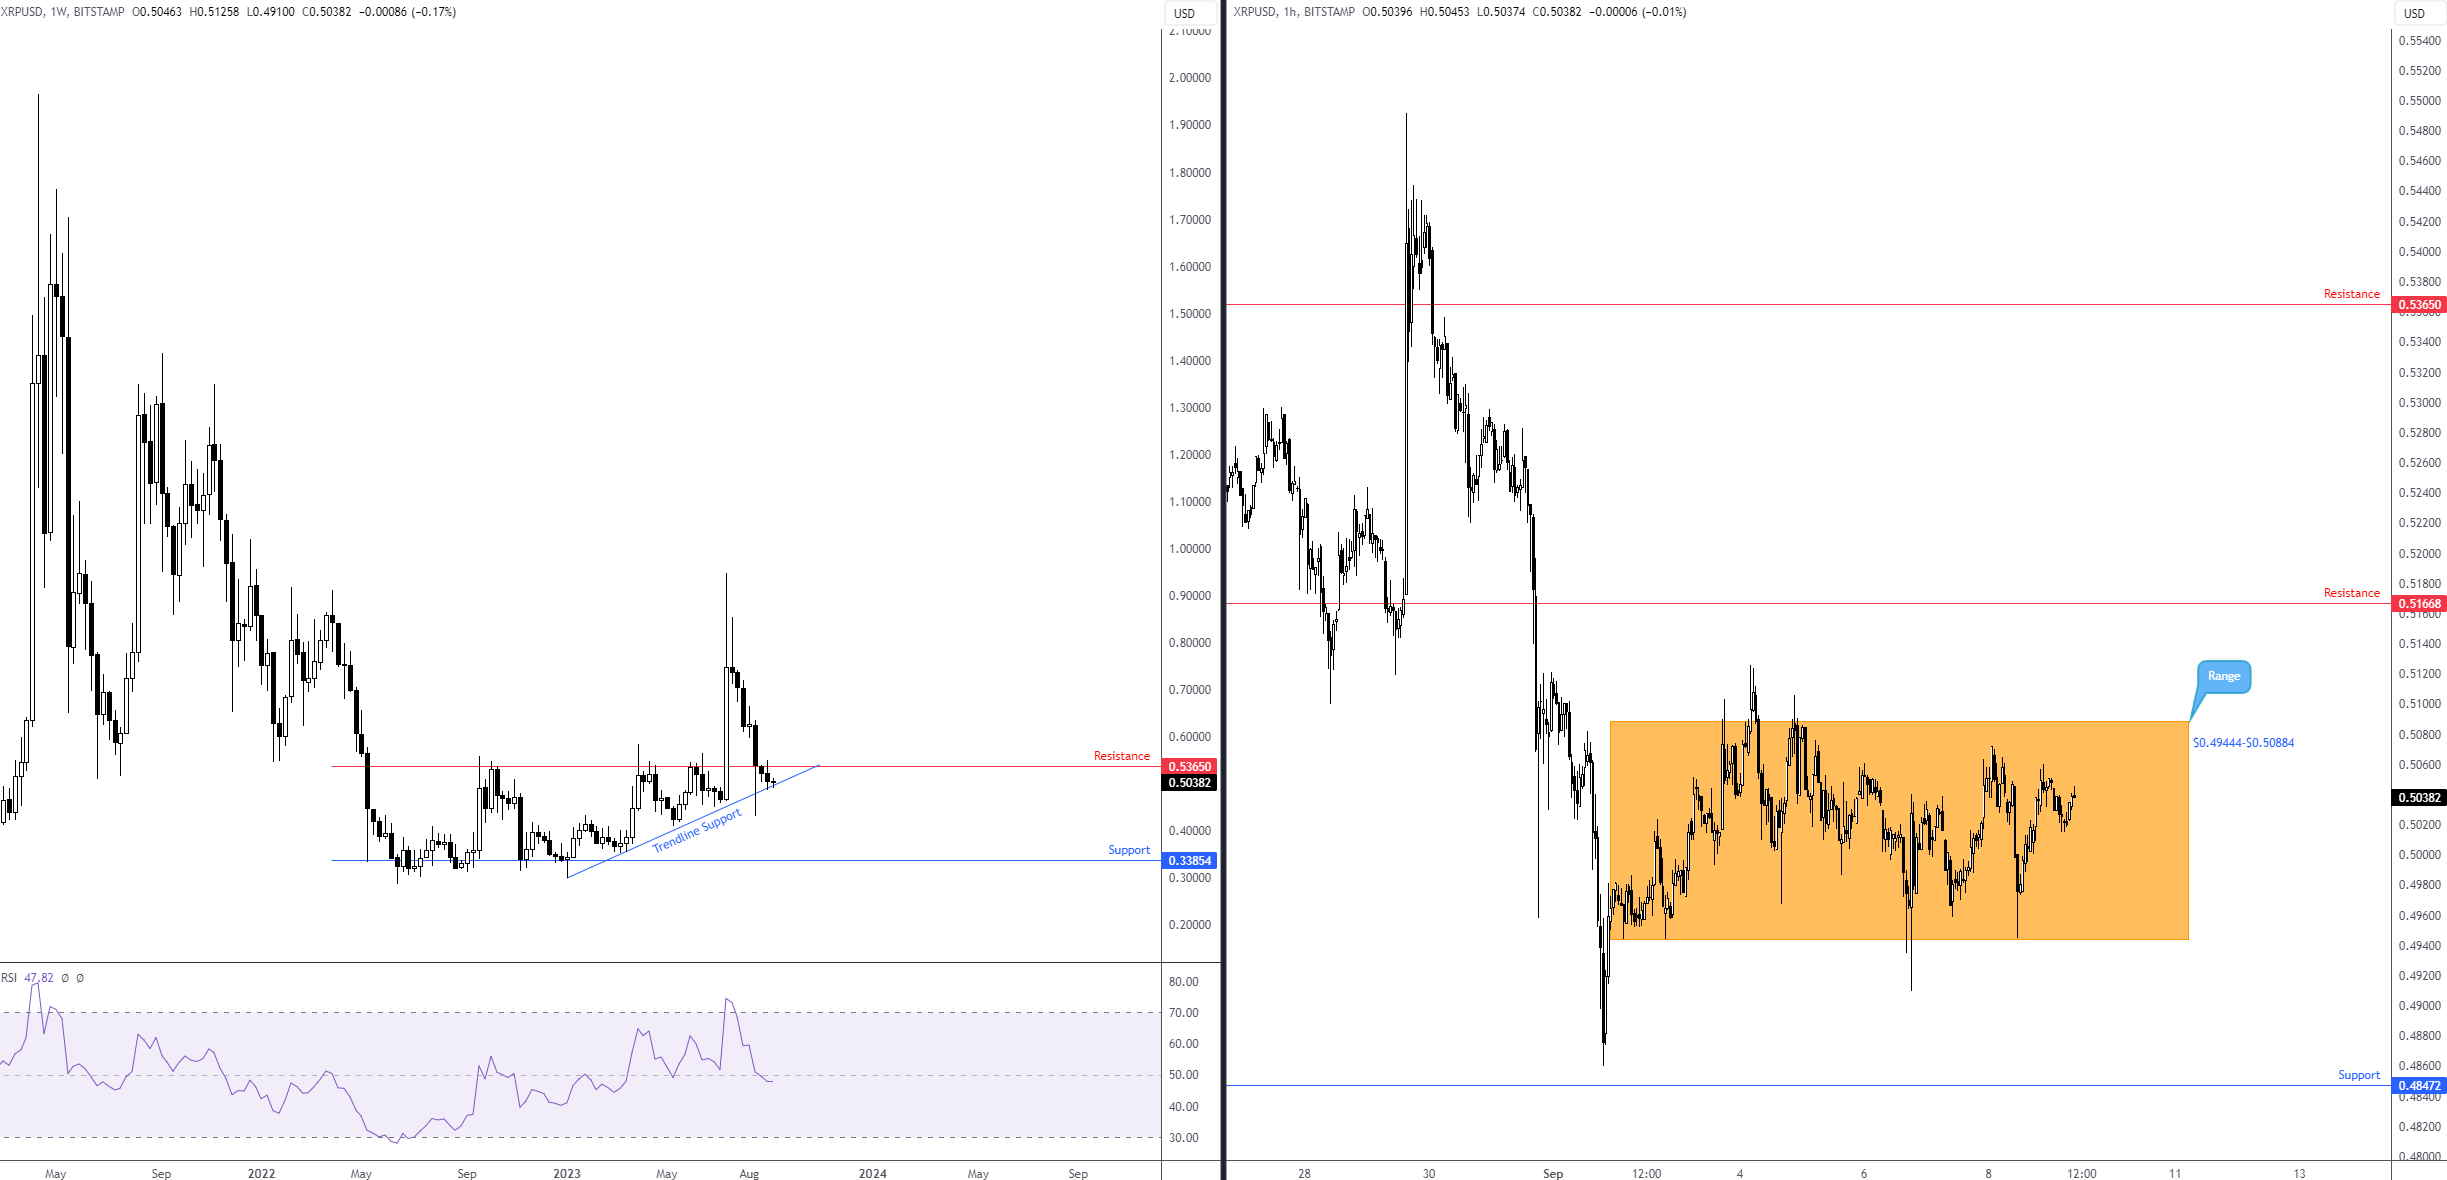
XRP/USD: Weekly trendline support remains vulnerable
Versus the US dollar, Ripple continues to challenge the grip of trendline support on the weekly timeframe, extended from the low of $0.3000. Overhead, weekly resistance is positioned nearby at $0.53650. Seeing as the trend has largely been lower since mid-2021, and the weekly chart’s Relative Strength Index (RSI) recently dipped a toe under its 50.00 centreline (negative momentum), the highlighted trendline support has a bold question mark attached to it. A break of this ascending support line may engage longer-term sellers, singling out weekly support as an obvious (initial) downside objective at $0.33854.
On the H1 timeframe, we have seen the unit consolidate between $0.49444 and $0.50884 since the beginning of September. Beyond the walls of this range, support and resistance warrant consideration at $0.48472 and $0.51668, respectively.
Having noted potential weakness at weekly trendline support, a breakout beneath the current H1 range this week is unlikely to raise too many eyebrows in the technical community. Such a move may also inspire a bearish showing; short-term breakout sellers consequently could take aim at the H1 support from $0.48472.
Charts: TradingView
This material on this website is intended for illustrative purposes and general information only. It does not constitute financial advice nor does it take into account your investment objectives, financial situation or particular needs. Commission, interest, platform fees, dividends, variation margin and other fees and charges may apply to financial products or services available from FP Markets. The information in this website has been prepared without taking into account your personal objectives, financial situation or needs. You should consider the information in light of your objectives, financial situation and needs before making any decision about whether to acquire or dispose of any financial product. Contracts for Difference (CFDs) are derivatives and can be risky; losses can exceed your initial payment and you must be able to meet all margin calls as soon as they are made. When trading CFDs you do not own or have any rights to the CFDs underlying assets.
FP Markets recommends that you seek independent advice from an appropriately qualified person before deciding to invest in or dispose of a derivative. A Product Disclosure Statement for each of the financial products is available from FP Markets can be obtained either from this website or on request from our offices and should be considered before entering into transactions with us. First Prudential Markets Pty Ltd (ABN 16 112 600 281, AFS Licence No. 286354).
Recommended Content
Editors’ Picks
EUR/USD stabilizes near 1.0500, looks to post weekly losses

EUR/USD extended its daily decline toward 1.0500 in the second half of the American session, pressured by the souring market mood. Despite the bullish action seen earlier in the week, the pair remains on track to register weekly losses.
GBP/USD falls below 1.2150 as USD rebounds

Following an earlier recovery attempt, GBP/USD turned south and declined below 1.2100 in the second half of the day on Friday. The negative shift seen in risk mood amid rising geopolitical tensions helps the US Dollar outperform its rivals and hurts the pair.
Gold advances to fresh multi-week highs above $1,920

Gold extended its daily rally and climbed above $1,920 for the first time in over two weeks on Friday. Escalating geopolitical tensions ahead of the weekend weigh on T-bond yields and provide a boost to XAU/USD, which remains on track to gain nearly 5% this week.
Bitcoin could be an alternative to US-listed companies but not in the short term

Bitcoin has dipped below $27,000, adding to the subdued cryptocurrency market sentiment. While short-term price concerns persist, analysts predict a rebound based on historical figures.
Nvidia Stock Forecast: NVDA slips as Biden administration attempts to close AI chip loophole

Nvida's stock price opened marginally lower on Friday after Reuters reported that the Biden administration is attempting to close a loophole that allowed Chinese companies access to state-of-the-art computer chips used for AI.