The first full week of October and the beginning of Q4 entertain two key central bank meetings, along with several risk events that grace the economic calendar. As a friendly reminder, stock markets in mainland China are closed all week in observance of the National Day holiday, with Hong Kong only closing on Monday.
The Reserve Bank of Australia (RBA) and the Reserve Bank of New Zealand (RBNZ) will be in the headlights, announcing their latest policy decisions. Markets and economists widely expect both central banks to remain on hold at 4.10% and 5.50%, respectively, marking the fourth consecutive meetings on hold for the RBA and RBNZ.
The September ISM manufacturing and services PMIs will also be a key watch this week on Monday and Wednesday, respectively. Economists anticipate a moderate uptick in the ISM manufacturing PMI to 47.8, though the current estimate range is between 48.0 and 47.0. Unless we see a marked downside deviation in this release, this will unlikely impact the dollar’s current run. The ISM Manufacturing PMI has been in contractionary territory (< 50.0) for ten consecutive months.
The US employment situation report is out on Friday for the month of September and is a staple event this week, with the median consensus pointing to a 150,000 print. This is down from 187,000 in August. The unemployment rate is expected to tick lower to 3.7% from 3.8%, and average hourly earnings is anticipated to have increased slightly from August to September to 0.3%, up from 0.2%. Upside surprises in these data could bolster USD demand; conversely, deviations to the downside might weigh on the buck. Before Friday’s release, however, the economic calendar welcomes several employment-related indicators, including the US JOLTs job openings data on Tuesday, ADP employment change on Wednesday and weekly jobless claims on Thursday.
It would be remiss not to feature the looming government shutdown in the US, set to take effect on 1 October (we’re writing this as of 30 September), which would affect official government releases, such as the non-farm payrolls this week, JOLTs and CPI reports (private sector data will be released as usual—think ISM surveys and ADP employment change and therefore they may take on more importance this week, particularly ADP). Assuming a shutdown materialises, the impact on the markets would be minor in the short term, but a longer-term shutdown could be a headwind for the overall economy. Another key observation, of course, is that the Fed is still data-dependent, and a lengthy shutdown could prove difficult for the Fed to set monetary policy. Of relevance, the average US government shutdown has lasted eight days despite the previous shutdown lasting 34 days.
G10 FX (5-day change)
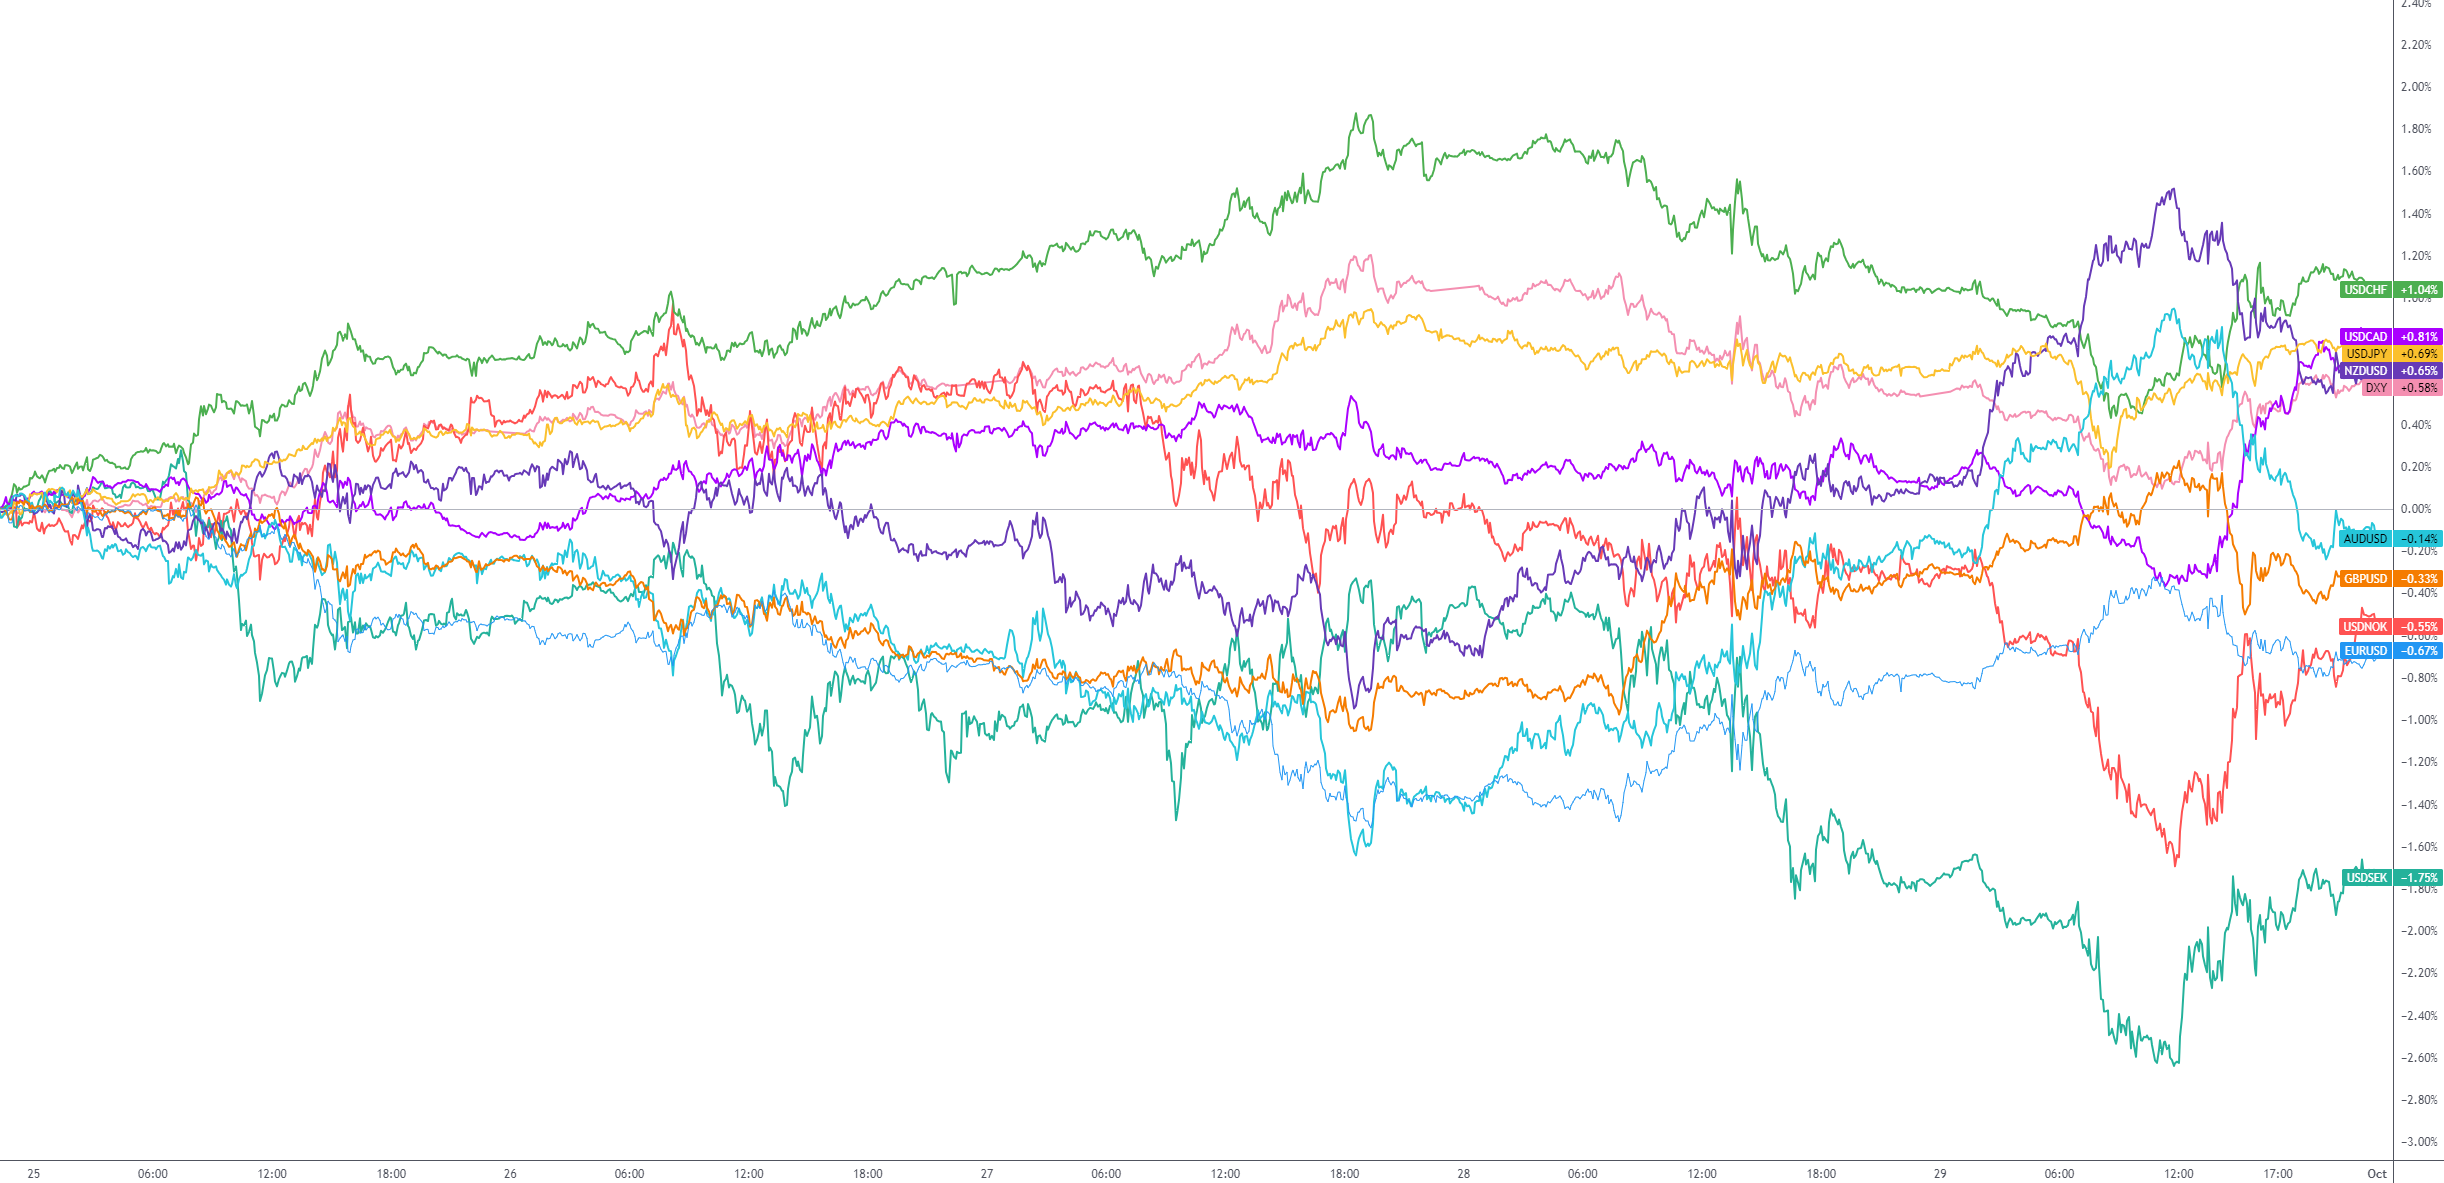
Charts: TradingView
Technical perspective for key markets
Dollar maintains bullish vibe, closes higher for 11th consecutive week
The Dollar Index ended an 11th week in positive territory and closed higher for a second month. This followed a to-the-point rebound from monthly support at 99.67. As communicated in previous research, the monthly timeframe’s long-term trend has been north since mid-2008, and the Q4 (2022) correction appears to have been viewed as a dip-buying opportunity from the monthly support noted above. Aided by the Relative Strength Index (RSI) on the monthly chart rebounding just north of the 50.00 centreline (positive momentum), airspace north of current price reveals room to extend recovery gains over the coming weeks (months) to resistance at 109.33.
Longer-term price action, therefore, is supportive of additional dollar upside for now.
Across the page on the daily timeframe, the second half of the week observed the buck hand back some of the week’s upside and retest support at 105.76. As you can see, despite the RSI on the daily chart testing the mettle of overbought space, the support retest attracted dip-buying on Friday. Do note that although the RSI is challenging its overbought area, the indicator can remain overbought for a prolonged period in trending markets.
Having noted room to approach higher terrain on the monthly scale, together with a retest of support on the daily chart last week, further buying could pull the Index towards last week’s top at 106.84 as an initial profit objective, with a break uncovering daily resistance at 107.61.
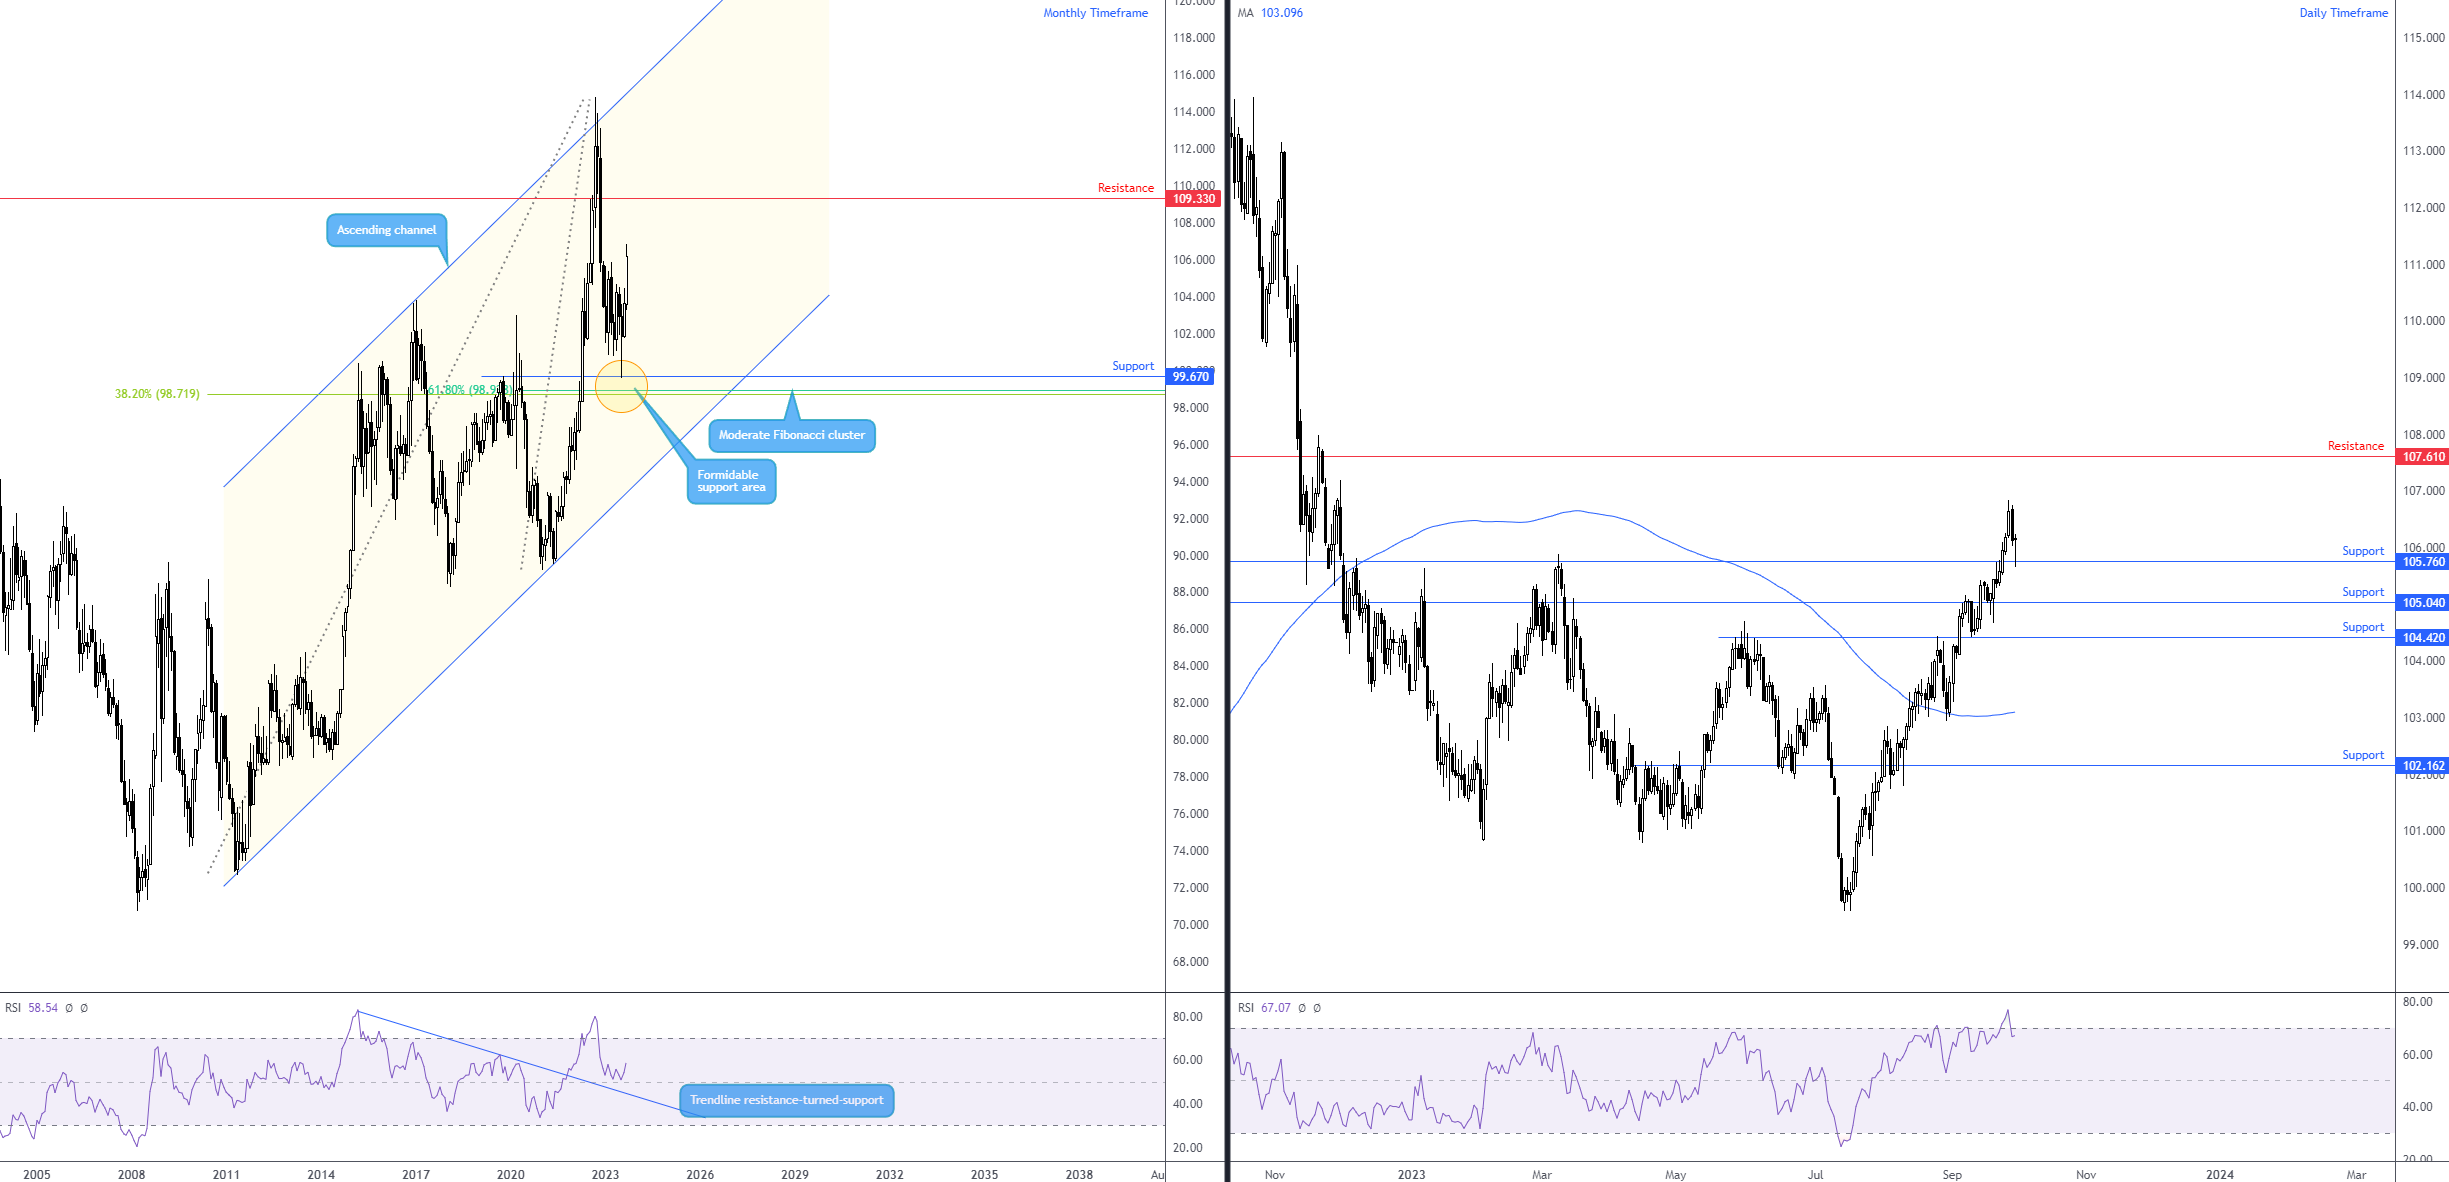
Charts: TradingView
AUD/USD: It’s a pattern thing?
The longer-term trend has been south since mid-2011, as evident from the monthly chart. Also visible from the monthly scale is the potential for a bearish pennant pattern to take shape, made up from $0.7158 and $0.6170. Most technicians will acknowledge that a bearish pennant pattern represents a continuation signal. Considering this and the trend pointing southbound, as well as the Relative Strength Index (RSI) circling south of 50.00 (negative momentum), a breakout to the downside could eventually unfold on the monthly chart and aim for support from $0.6135.
On the daily timeframe, the unit has been fluctuating between the limits of a descending channel between $0.6364 and $0.6522 since mid-August. You will also note that support intersects the pattern’s structure at $0.6397, and resistance calls for attention just north of the pattern’s framework at $0.6565. Should the monthly timeframe’s pattern hold, sellers making a show from the upper boundary of the daily descending channel and nearby resistance at $0.6565 could come to fruition this week. This may lead to price targeting a break of daily support from $0.6397 and eventually dethroning the lower boundary of the daily descending pattern.
Weekly and daily charts
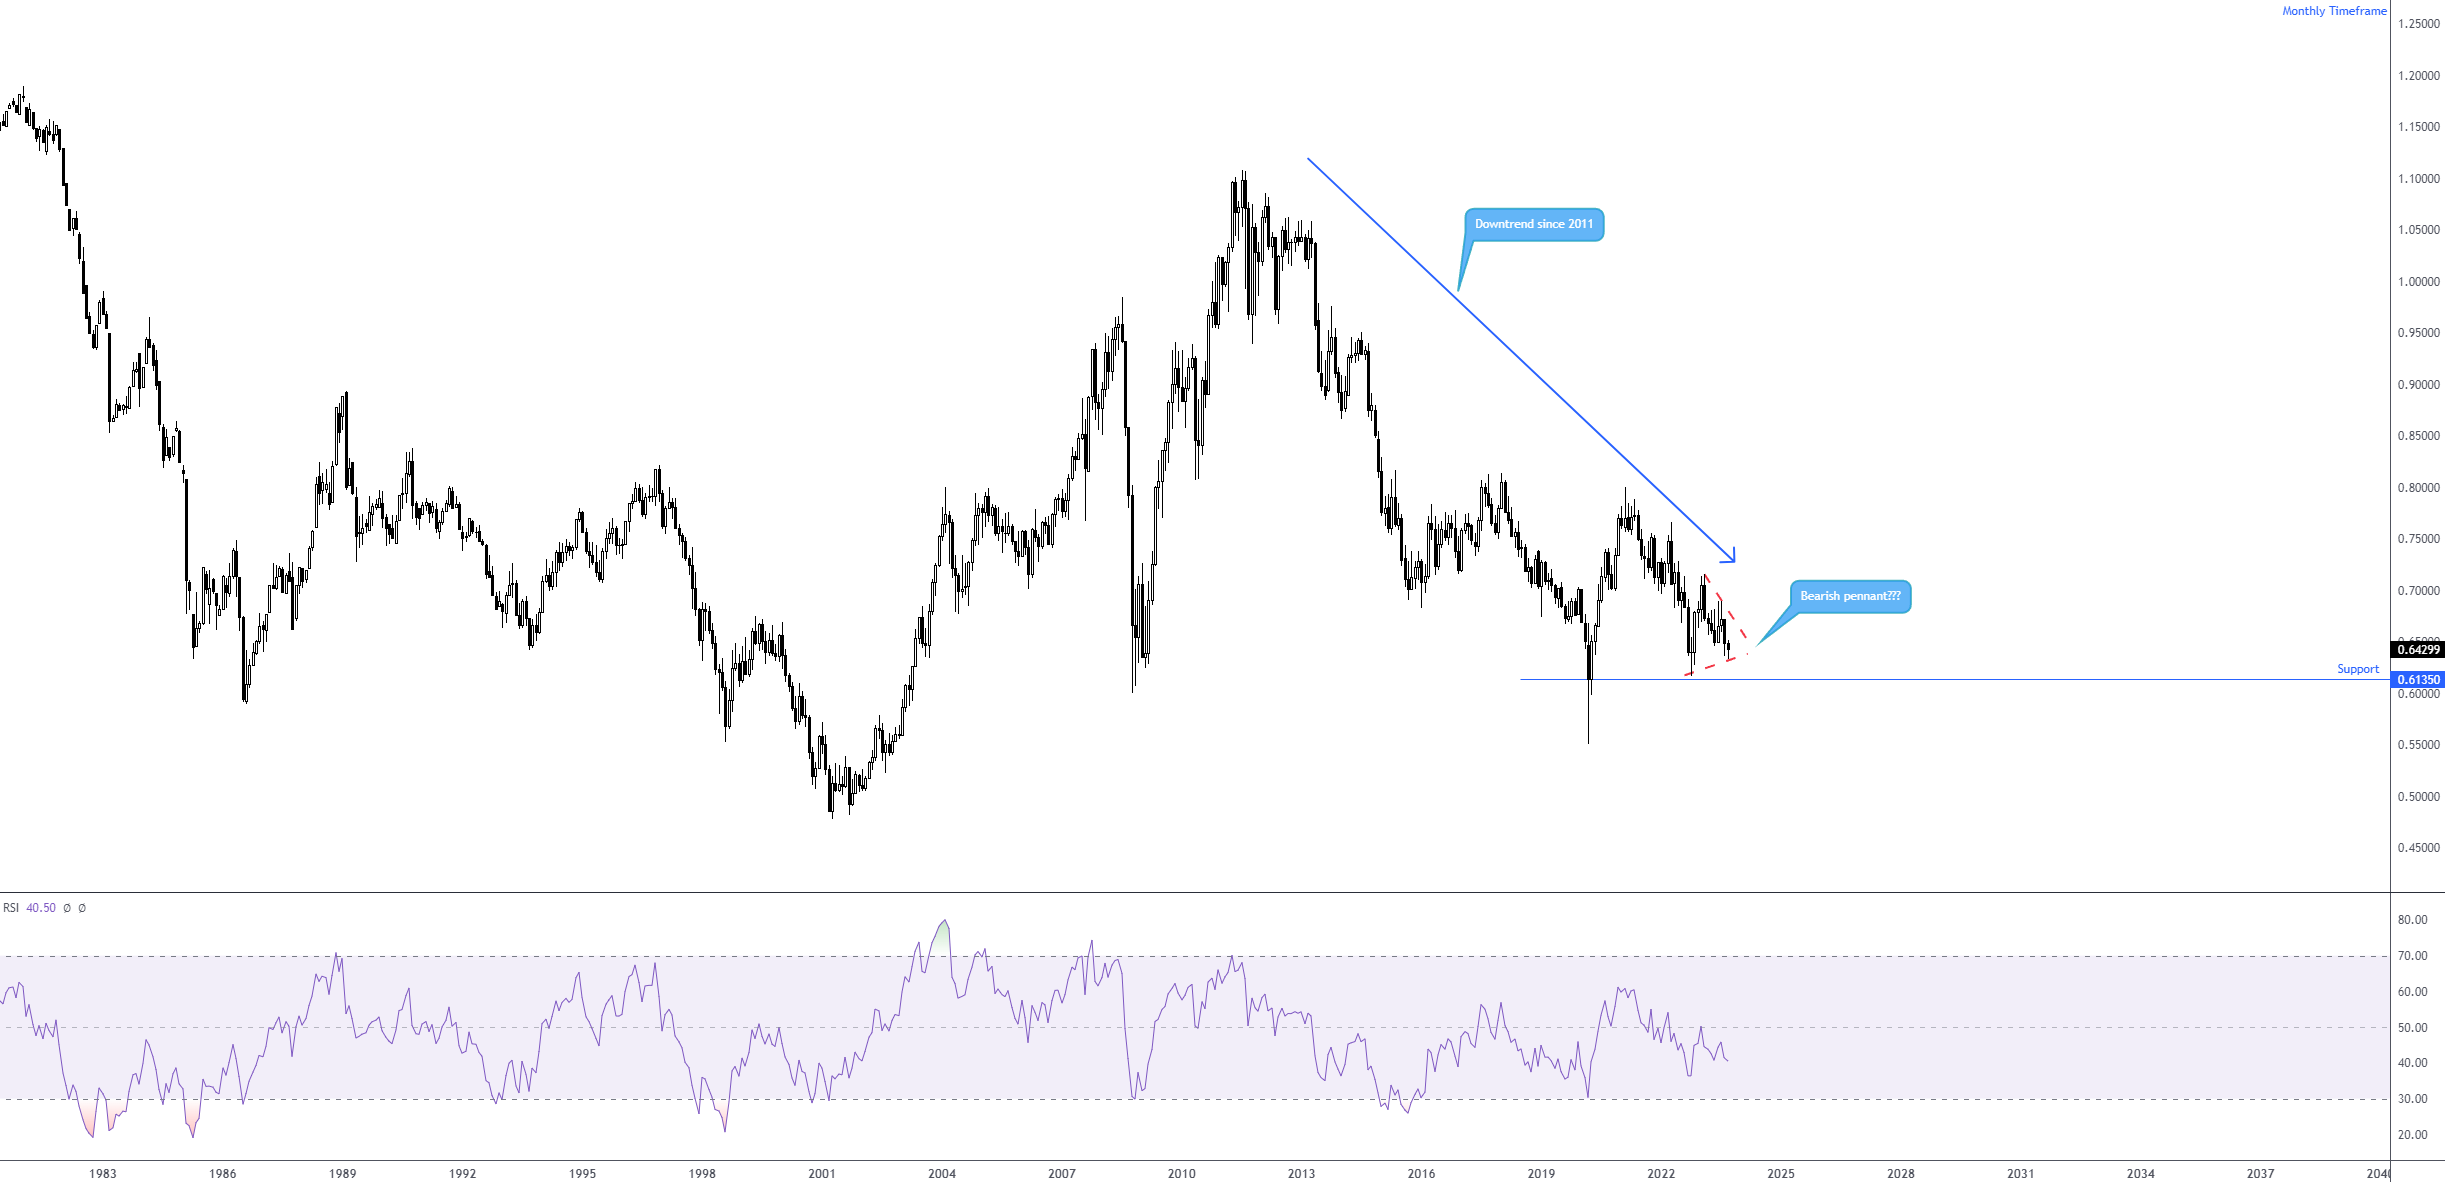
Charts: TradingView
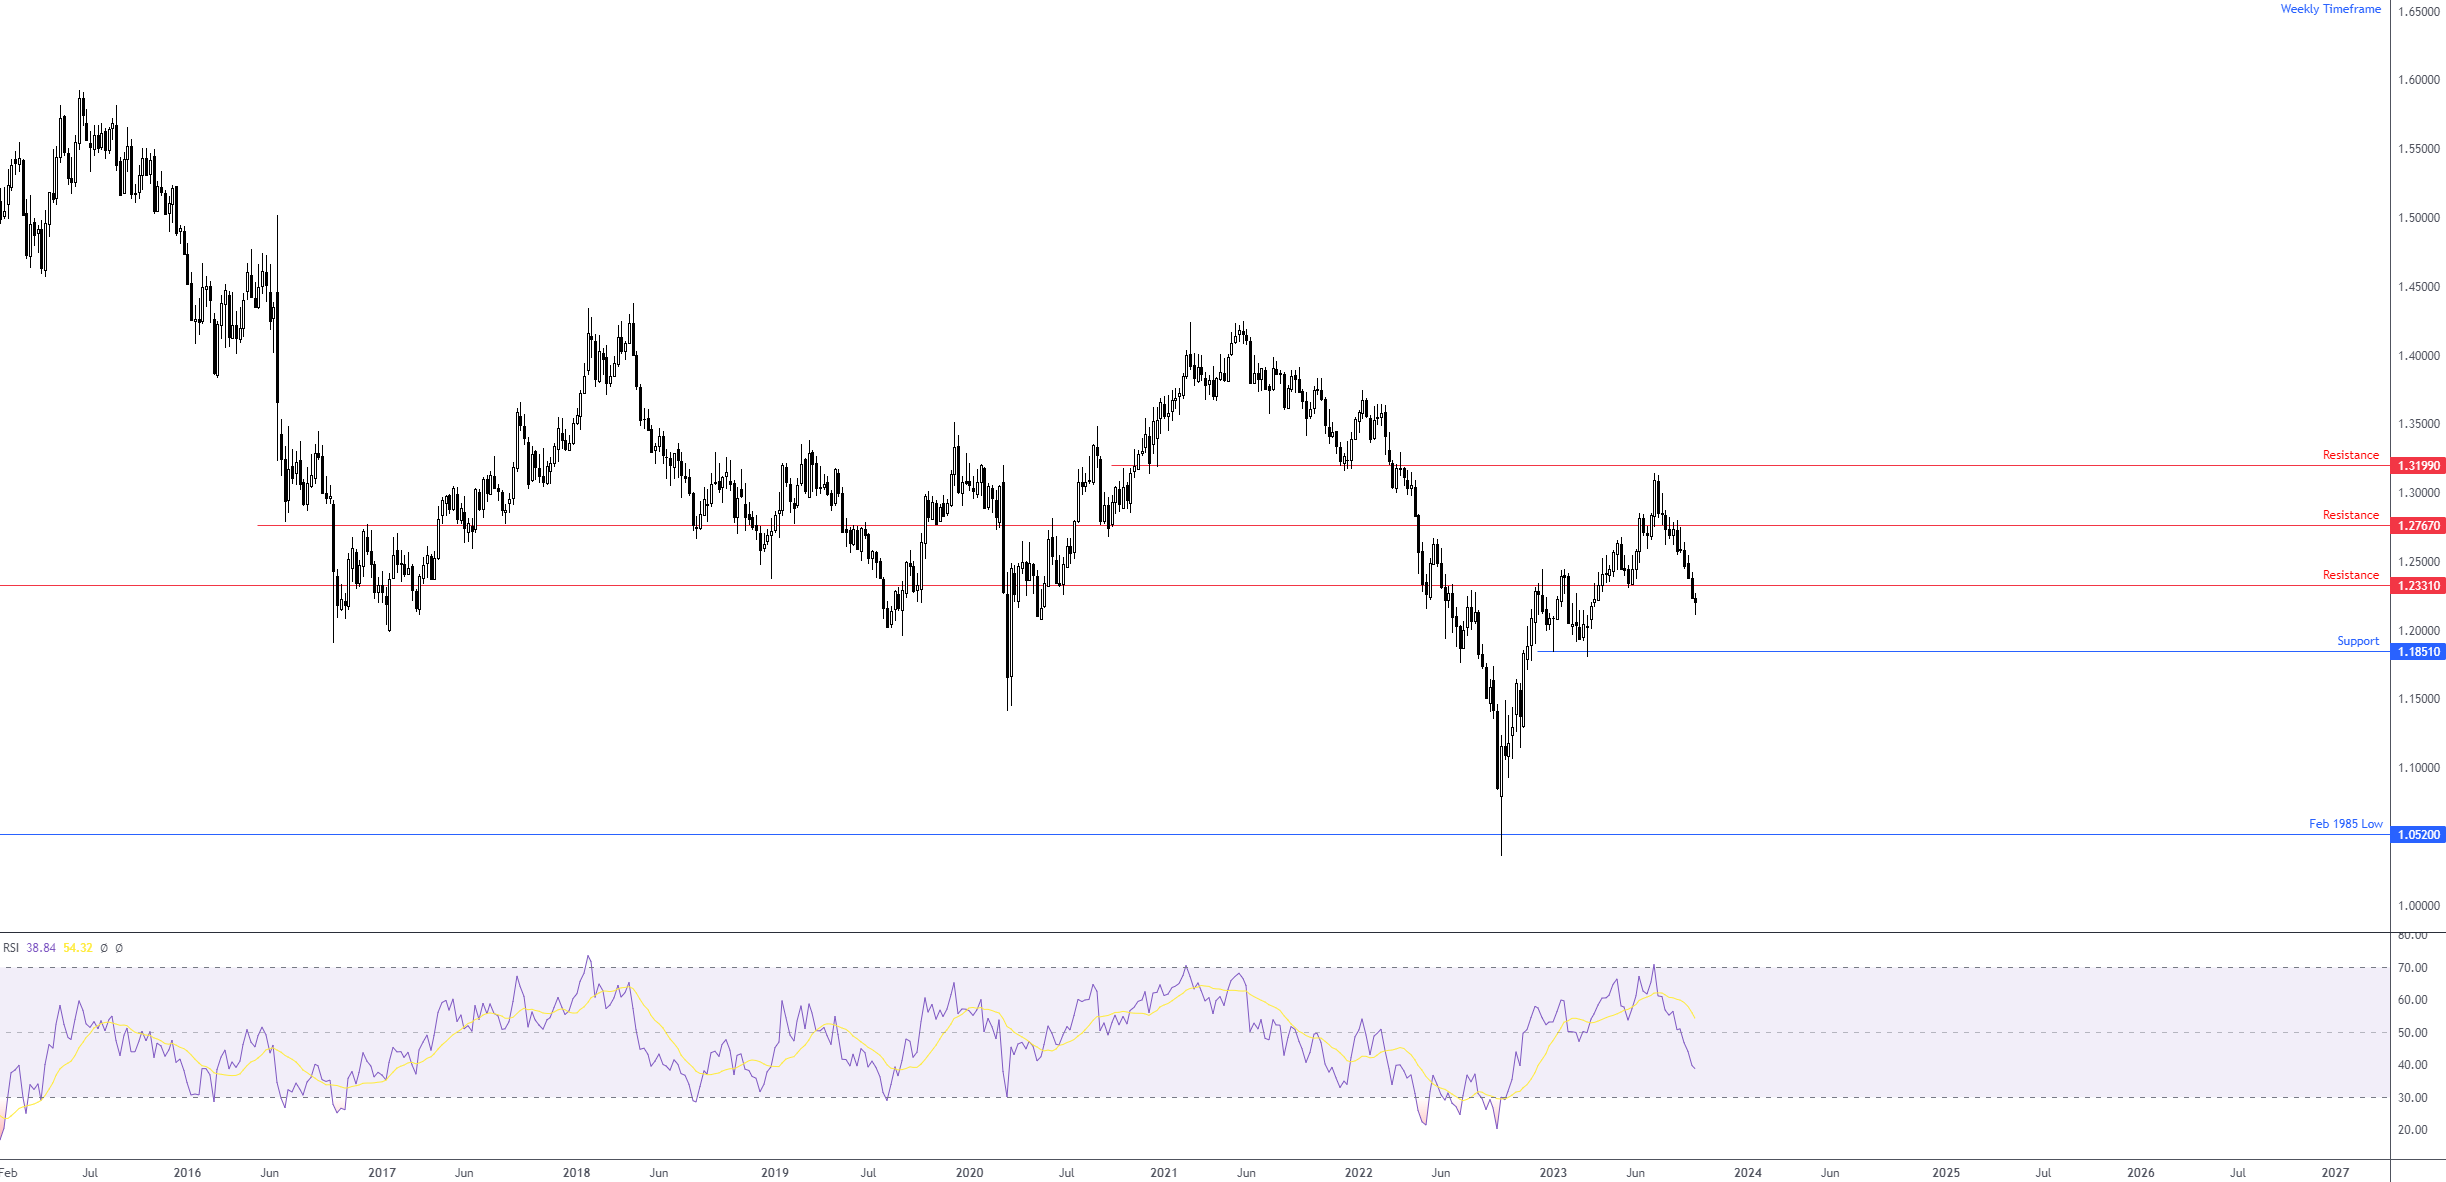
GBP/USD: Bears in the driving seat
Against the US dollar, sterling wrapped up a fourth week underwater, down -0.3%. Weekly support from $1.2331 was taken out the prior week and remains a resistance base to consider this week; support on the weekly chart warrants attention as far south as $1.1851. This, joined by the Relative Strength Index (RSI) cementing position beneath the 50.00 centreline (negative momentum), could have sellers remain at the wheel.
Drilling down to the daily timeframe, you will note that Friday concluded the session considerably off best levels after touching gloves with resistance at $1.2272. Interestingly, if you open the hourly chart here, you’ll see a picture-perfect AB=CD approach formed towards the underside of the said daily level (a textbook sell-on-rally setup).
Although the RSI reveals signs of rebounding from oversold space on the daily chart, the room seen for weekly sellers to explore deeper waters this week and Friday’s reaction from daily resistance highlighted above at $1.2272 could be sufficient to attract further selling over the coming week. In terms of downside targets, last week’s session trough at $1.2110 is a reasonable base to aim for, followed by daily support at $1.2019.
Weekly and daily charts:
Charts: TradingView
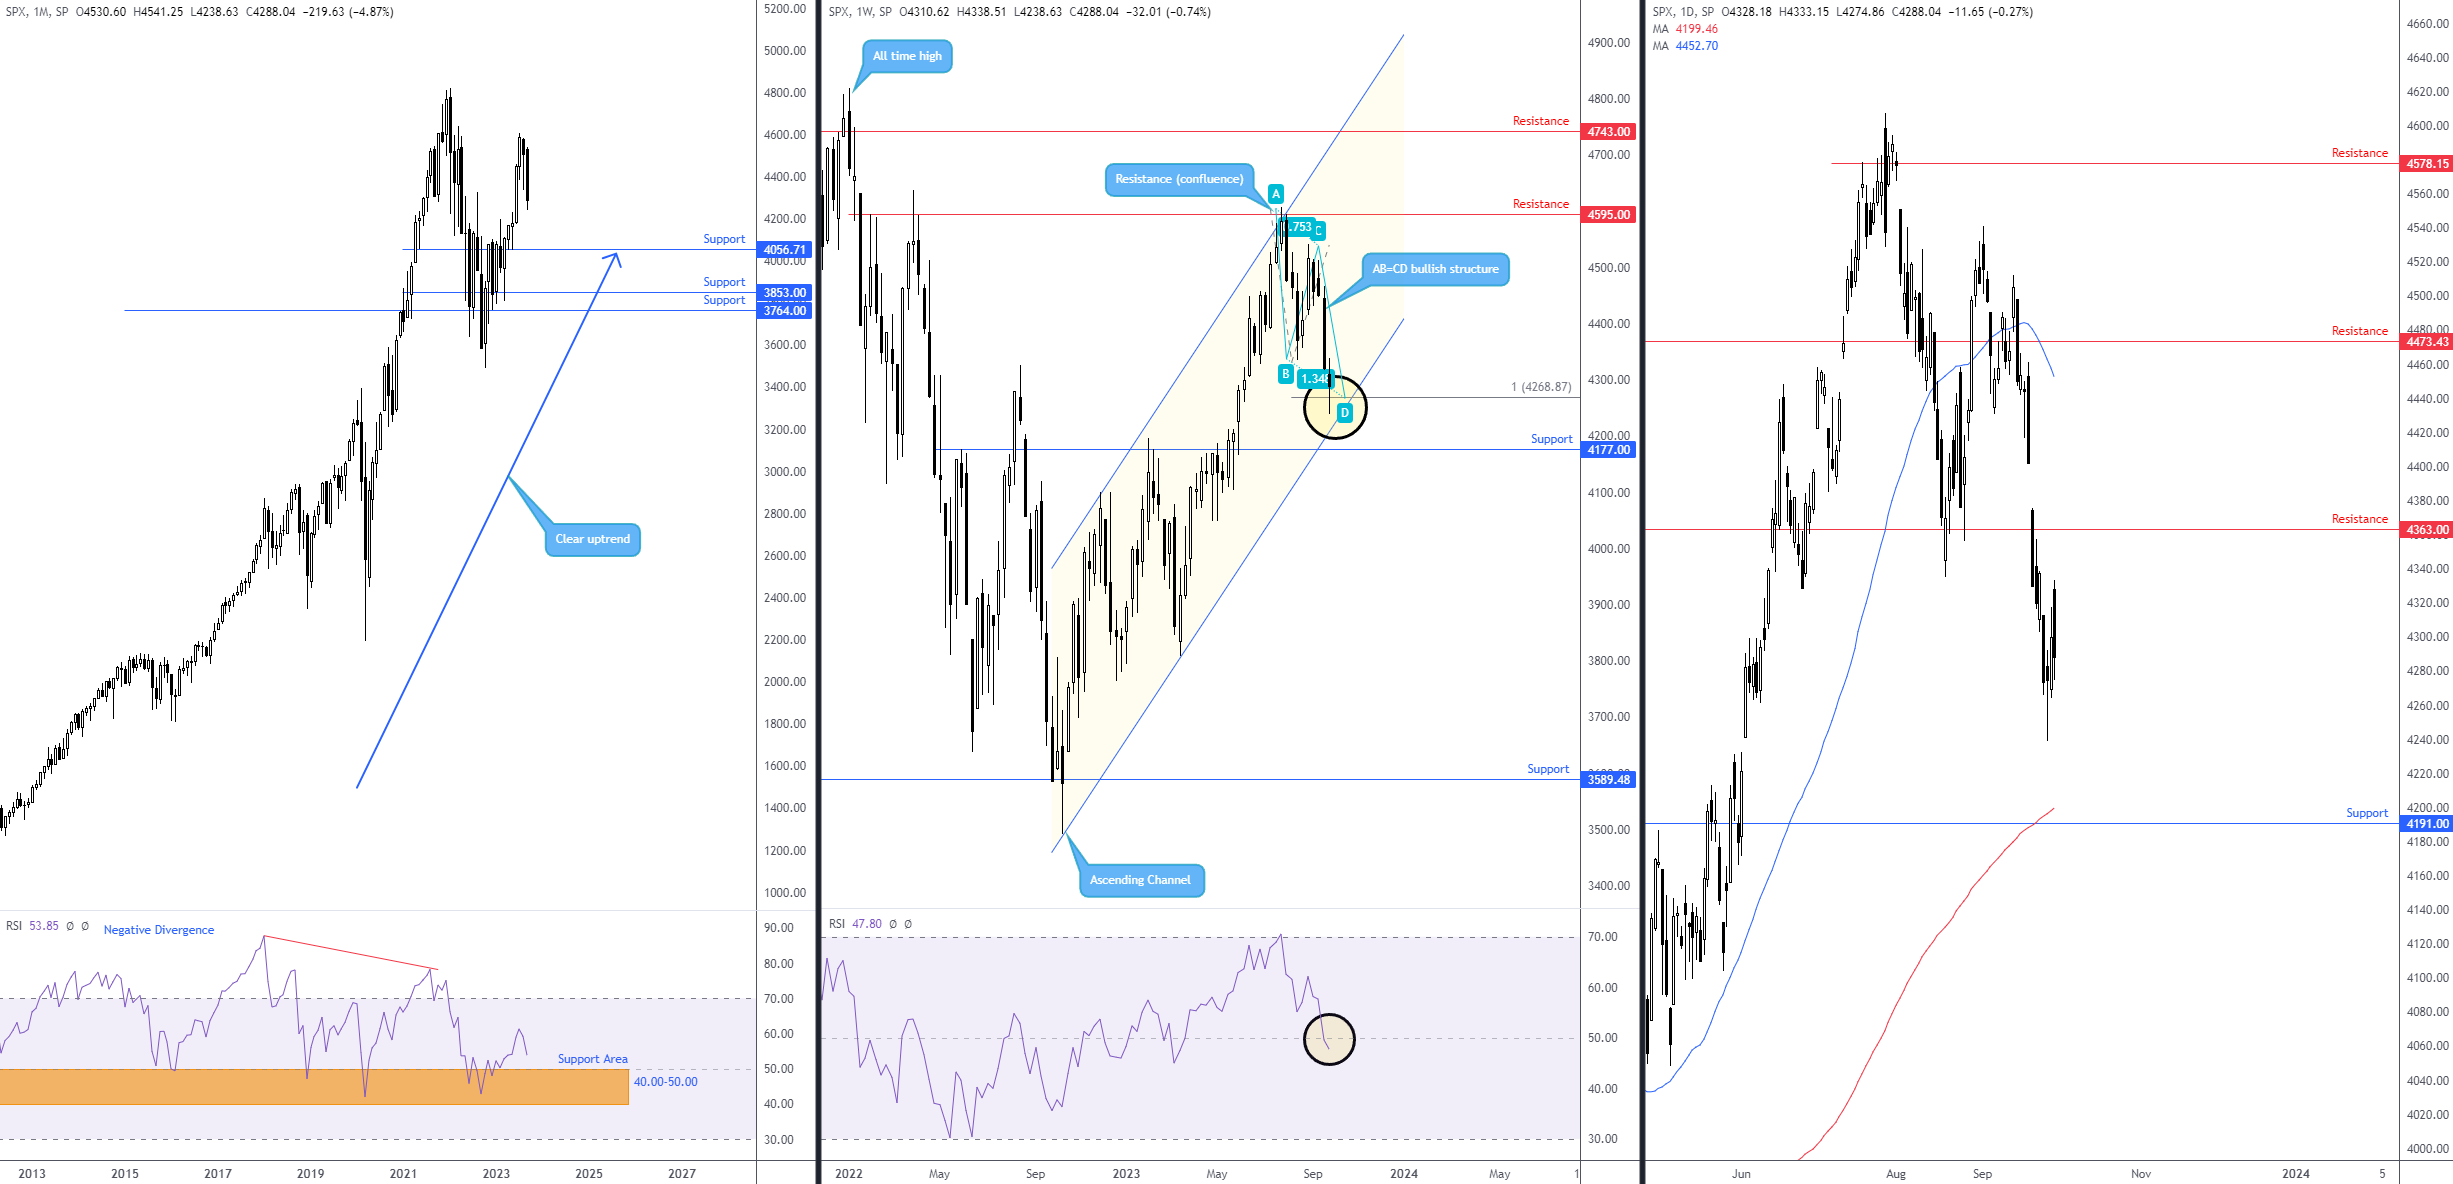
S&P 500: Daily resistance could be pivotal this week
Major US equity indices finished lower across the board in September, with the S&P 500 down nearly -5.0%.
The trend remains north on the bigger picture (the monthly timeframe), and the index was on track to challenge all-time highs of 4,818. That was, of course, until last month’s downside move, which gathered steam on the back of the Fed’s longer-for-higher narrative taking hold. Should further selling unfold, support is not expected to materialise on the monthly chart until 4,056.
While the monthly timeframe displays a bearish bias in terms of technical structure with the scope to continue pressing southbound, the weekly chart recently shook hands with an equivalent AB=CD harmonic support level at 4,268 in a market trending higher since late 2022, depicted by a 100% projection ratio. You will note that although the Relative Strength Index (RSI) on the weekly timeframe has marginally dipped a toe in waters south of its 50.00 centreline (negative momentum), it could still find a floor at this point to aid the current harmonic structure and neighbouring channel support extended from the low of 3,491.
From the daily timeframe, however, we can see that price pencilled in a floor around 4,238 (bolstered by weekly support highlighted above). Now, support on the daily chart is lower at 4,191, which shares space with the 200-day simple moving average at 4,199. Daily resistance calls for attention at 4,363 this week and is a pivotal base to watch.
Although higher timeframes tend to take precedence, it is important to note that we have the monthly chart showing us that sellers may take things lower over the coming weeks towards monthly support of 4,056, but according to the weekly chart, we also have weekly price entrenched within an uptrend which recently formed AB=CD bullish structure near channel support. Consequently, should sellers put in an appearance beneath (or at) resistance on the daily timeframe from 4,363, this favours selling based on the monthly timeframe’s direction toward daily support at 4,191, while a daily close above the said daily resistance throws light on further upside based on the weekly timeframe’s AB=CD structure and could mean we may see all-time highs before the year is out.
Time will tell!
Charts: TradingView
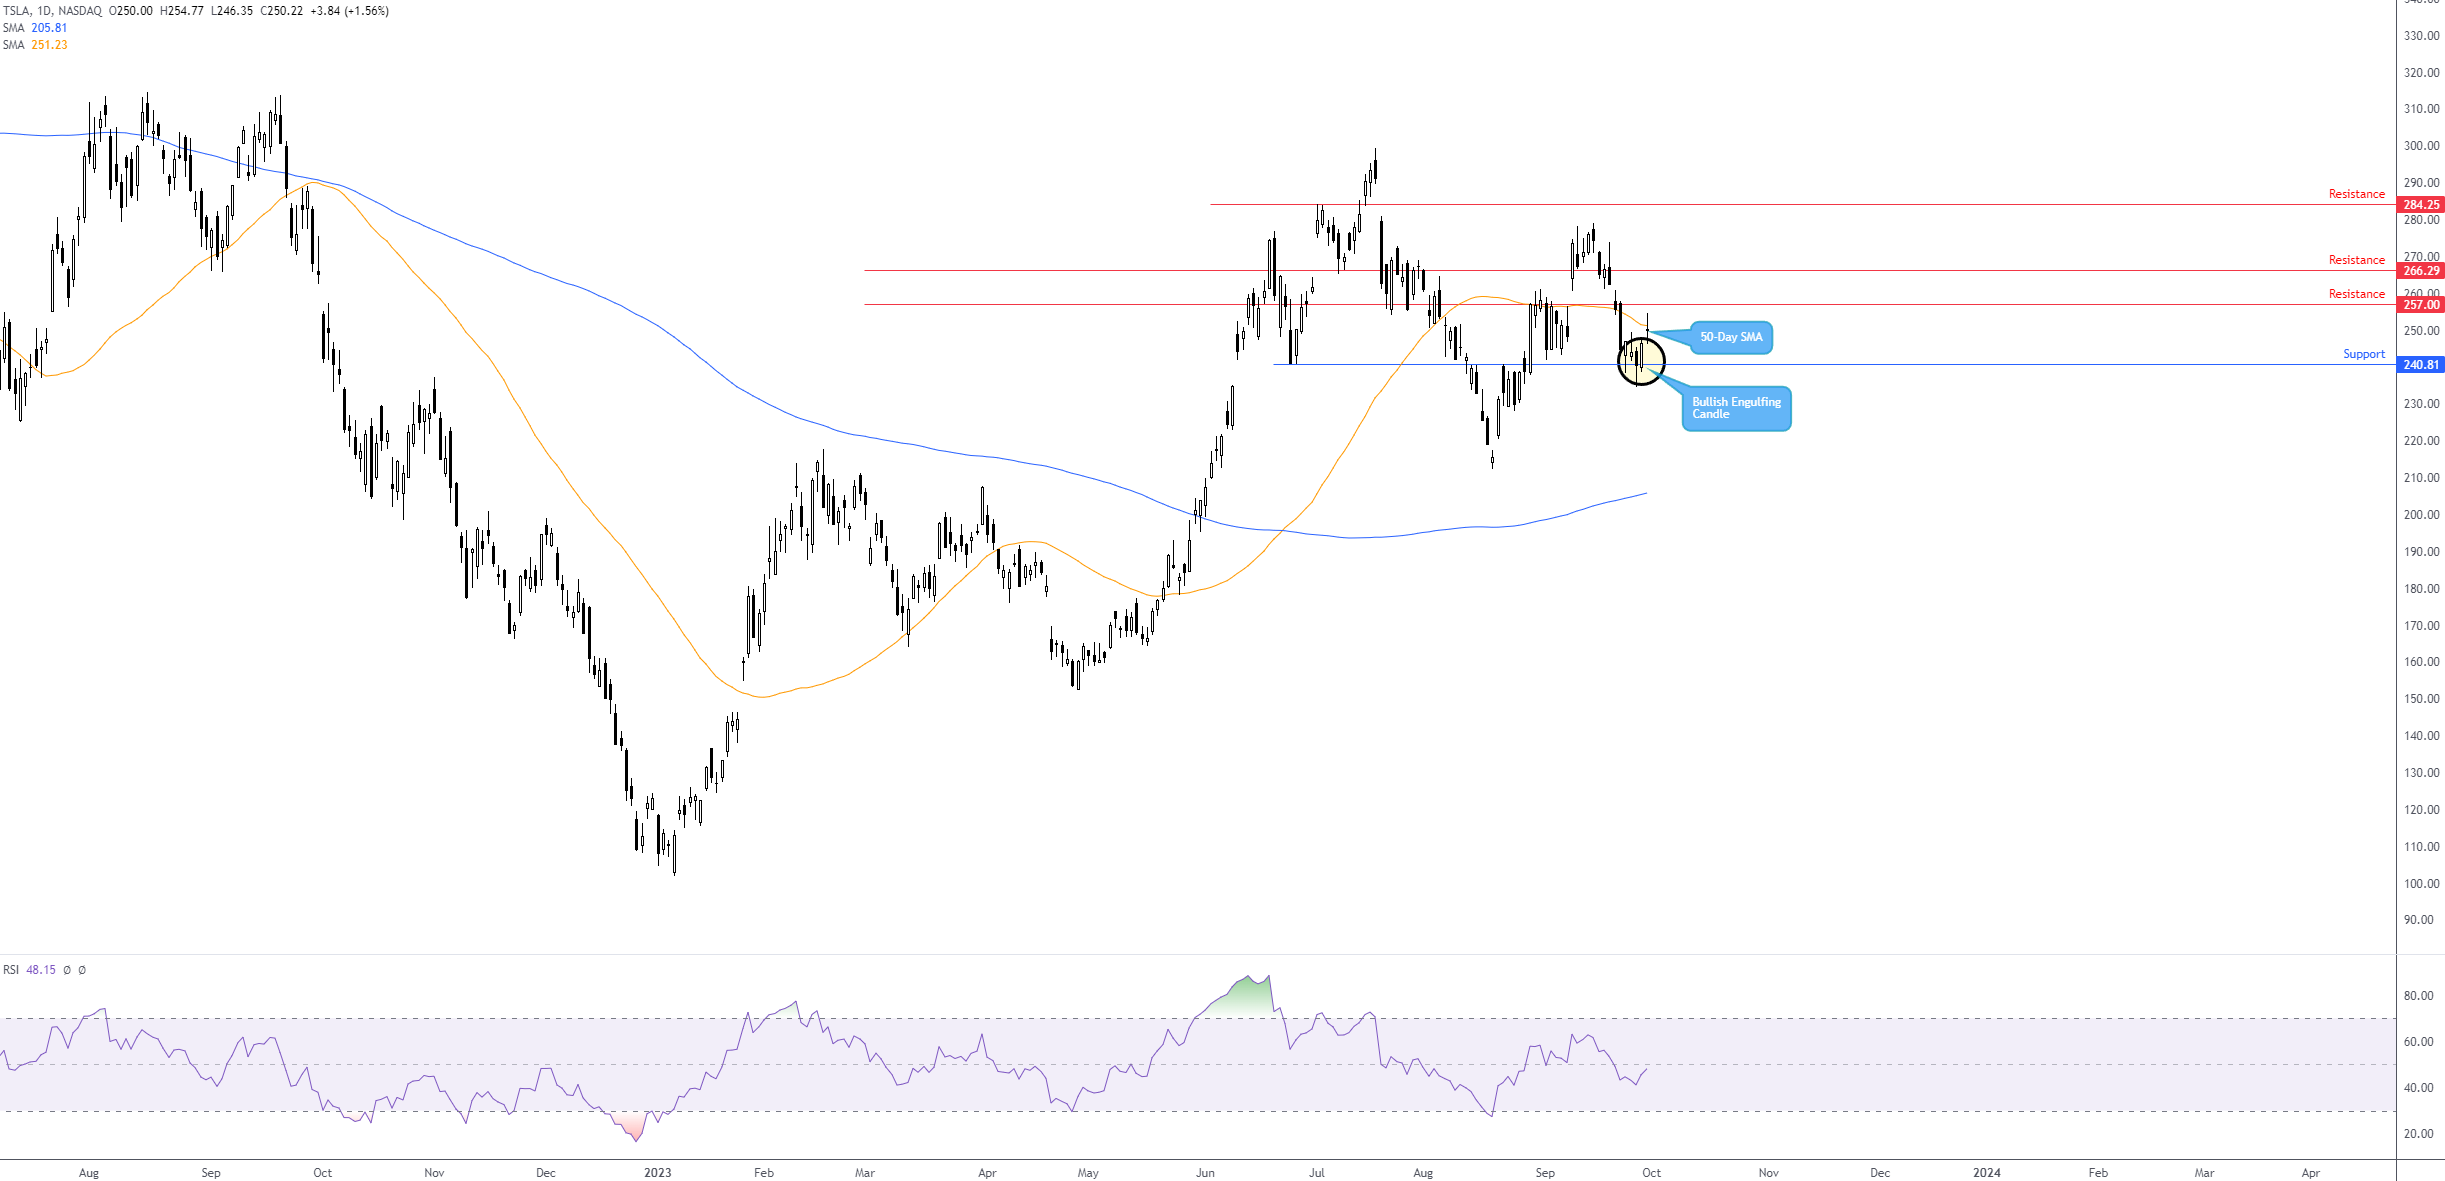
Tesla (TSLA): Daily bullish engulfing to prompt bulls?
The daily chart of Tesla (TSLA) chalked up a bullish engulfing candle from support at $240.81 on Thursday. Additional outperformance from Friday’s follow-through indecision candle could have the stock attempt to overthrow the nearby 50-day simple moving average at $251.23 and target resistances seen nearby at $257.00 and $266.29. A subsequent nudge beyond these levels exposes tops around $278.98, situated a touch south of resistance at $284.25.
Potentially aiding a continuation to the upside would be a dominant daily close above the 50-day simple moving average this week, alongside the Relative Strength Index (RSI) moving above its 50.00 centreline. This informs traders and investors that average gains exceed average losses: positive momentum.
Charts: TradingView
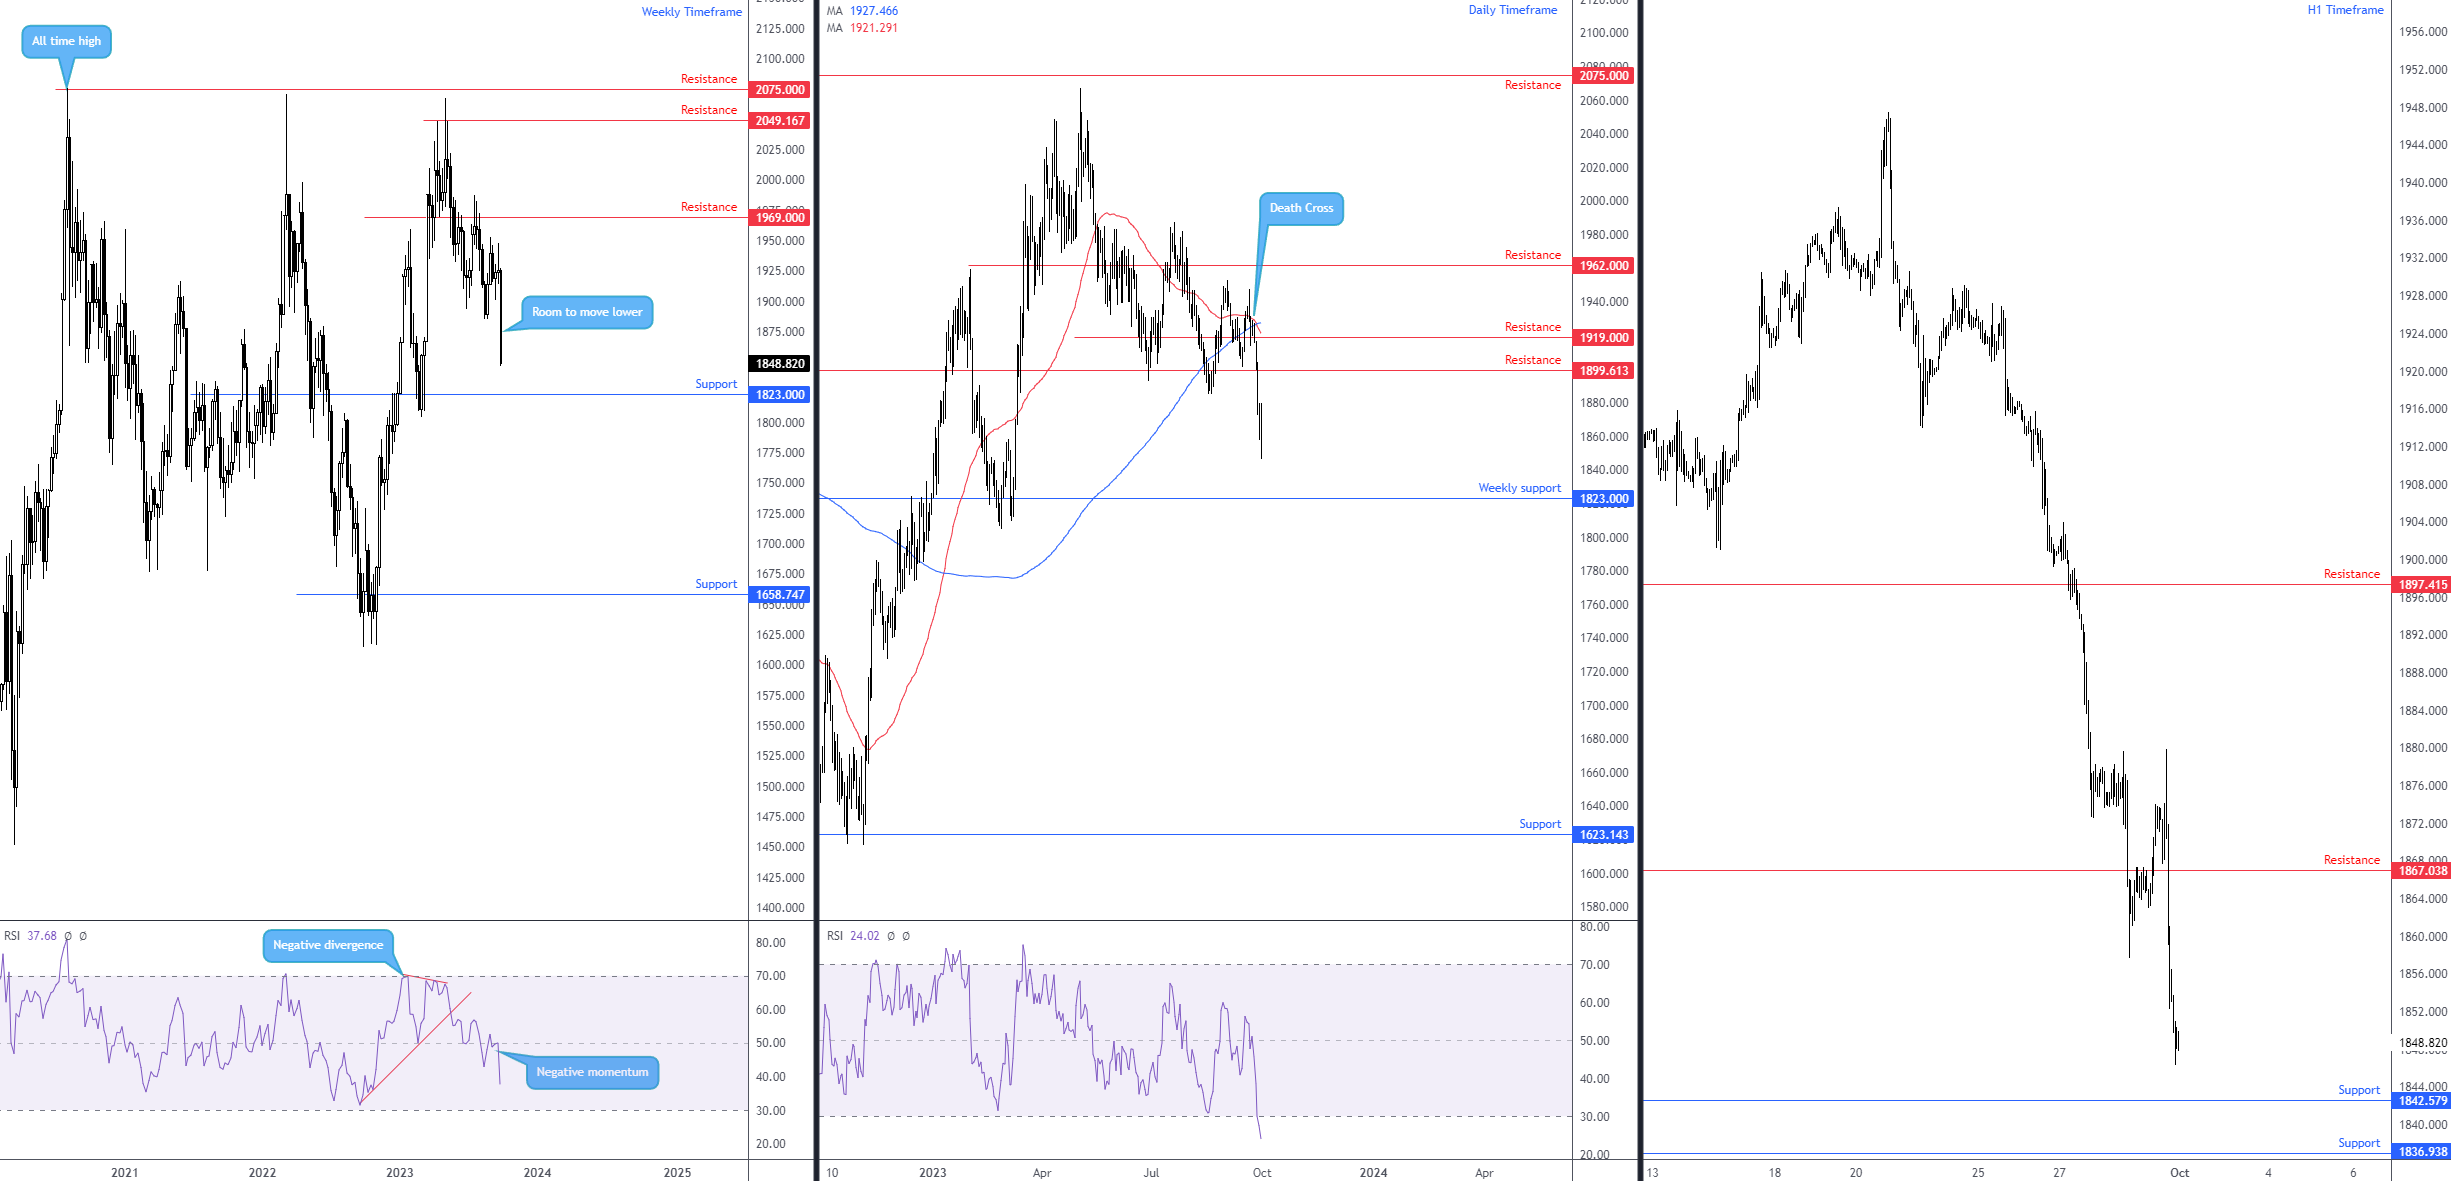
Spot Gold (XAU/USD) prints largest one-week loss this year
In a one-sided weekly decline, the price of spot gold fell -4.0% against the US dollar last week. Weighed by the higher-for-longer theme and higher US yields, along with persistent USD demand, the yellow metal is poised to continue lower, with weekly support at $1,823 firmly in the crosshairs.
Also seen from the weekly scale, together with the Relative Strength Index (RSI) working beneath its 50.00 centreline (negative momentum), the unit has been on the back foot since topping within striking distance of all-time highs of $2,075 at the beginning of May.
The weekly chart’s downside bias is evident on the daily timeframe, emphasised by a series of lower lows and lower highs: defined downtrend. The recent Death Cross stresses this: the 50-day simple moving average at $1,921 crossing below the 200-day simple moving average at $1,927, which means that the average closing prices over the short term are now below the longer-term average closing prices and suggests this market could be headed for a longer-term downward move. Also interesting on the daily chart is the lack of support evident until the weekly base featured above at $1,823.
While things point to further technical weakness this week, it is worth pointing out that the RSI on the daily chart entered oversold terrain for the first time this year. However, although this can portend a reversal to the upside, it is common to see the RSI remain in oversold territory for lengthy periods in down-trending environments and deliver several false buy signals.
Over on the H1 timeframe, there’s also a lack of support evident until around $1,842 (closely followed by another layer of H1 support at $1,836), with resistance plotted at $1,867. In view of both the weekly and daily timeframes implying that sellers may remain dominant, a pullback on the H1 to resistance at $1,867 could be a setup that welcomes selling towards $1,842. Alternatively, should sellers continue to weigh on the current price, breakout selling opportunities may be present on the lower timeframes this week.
Charts: TradingView
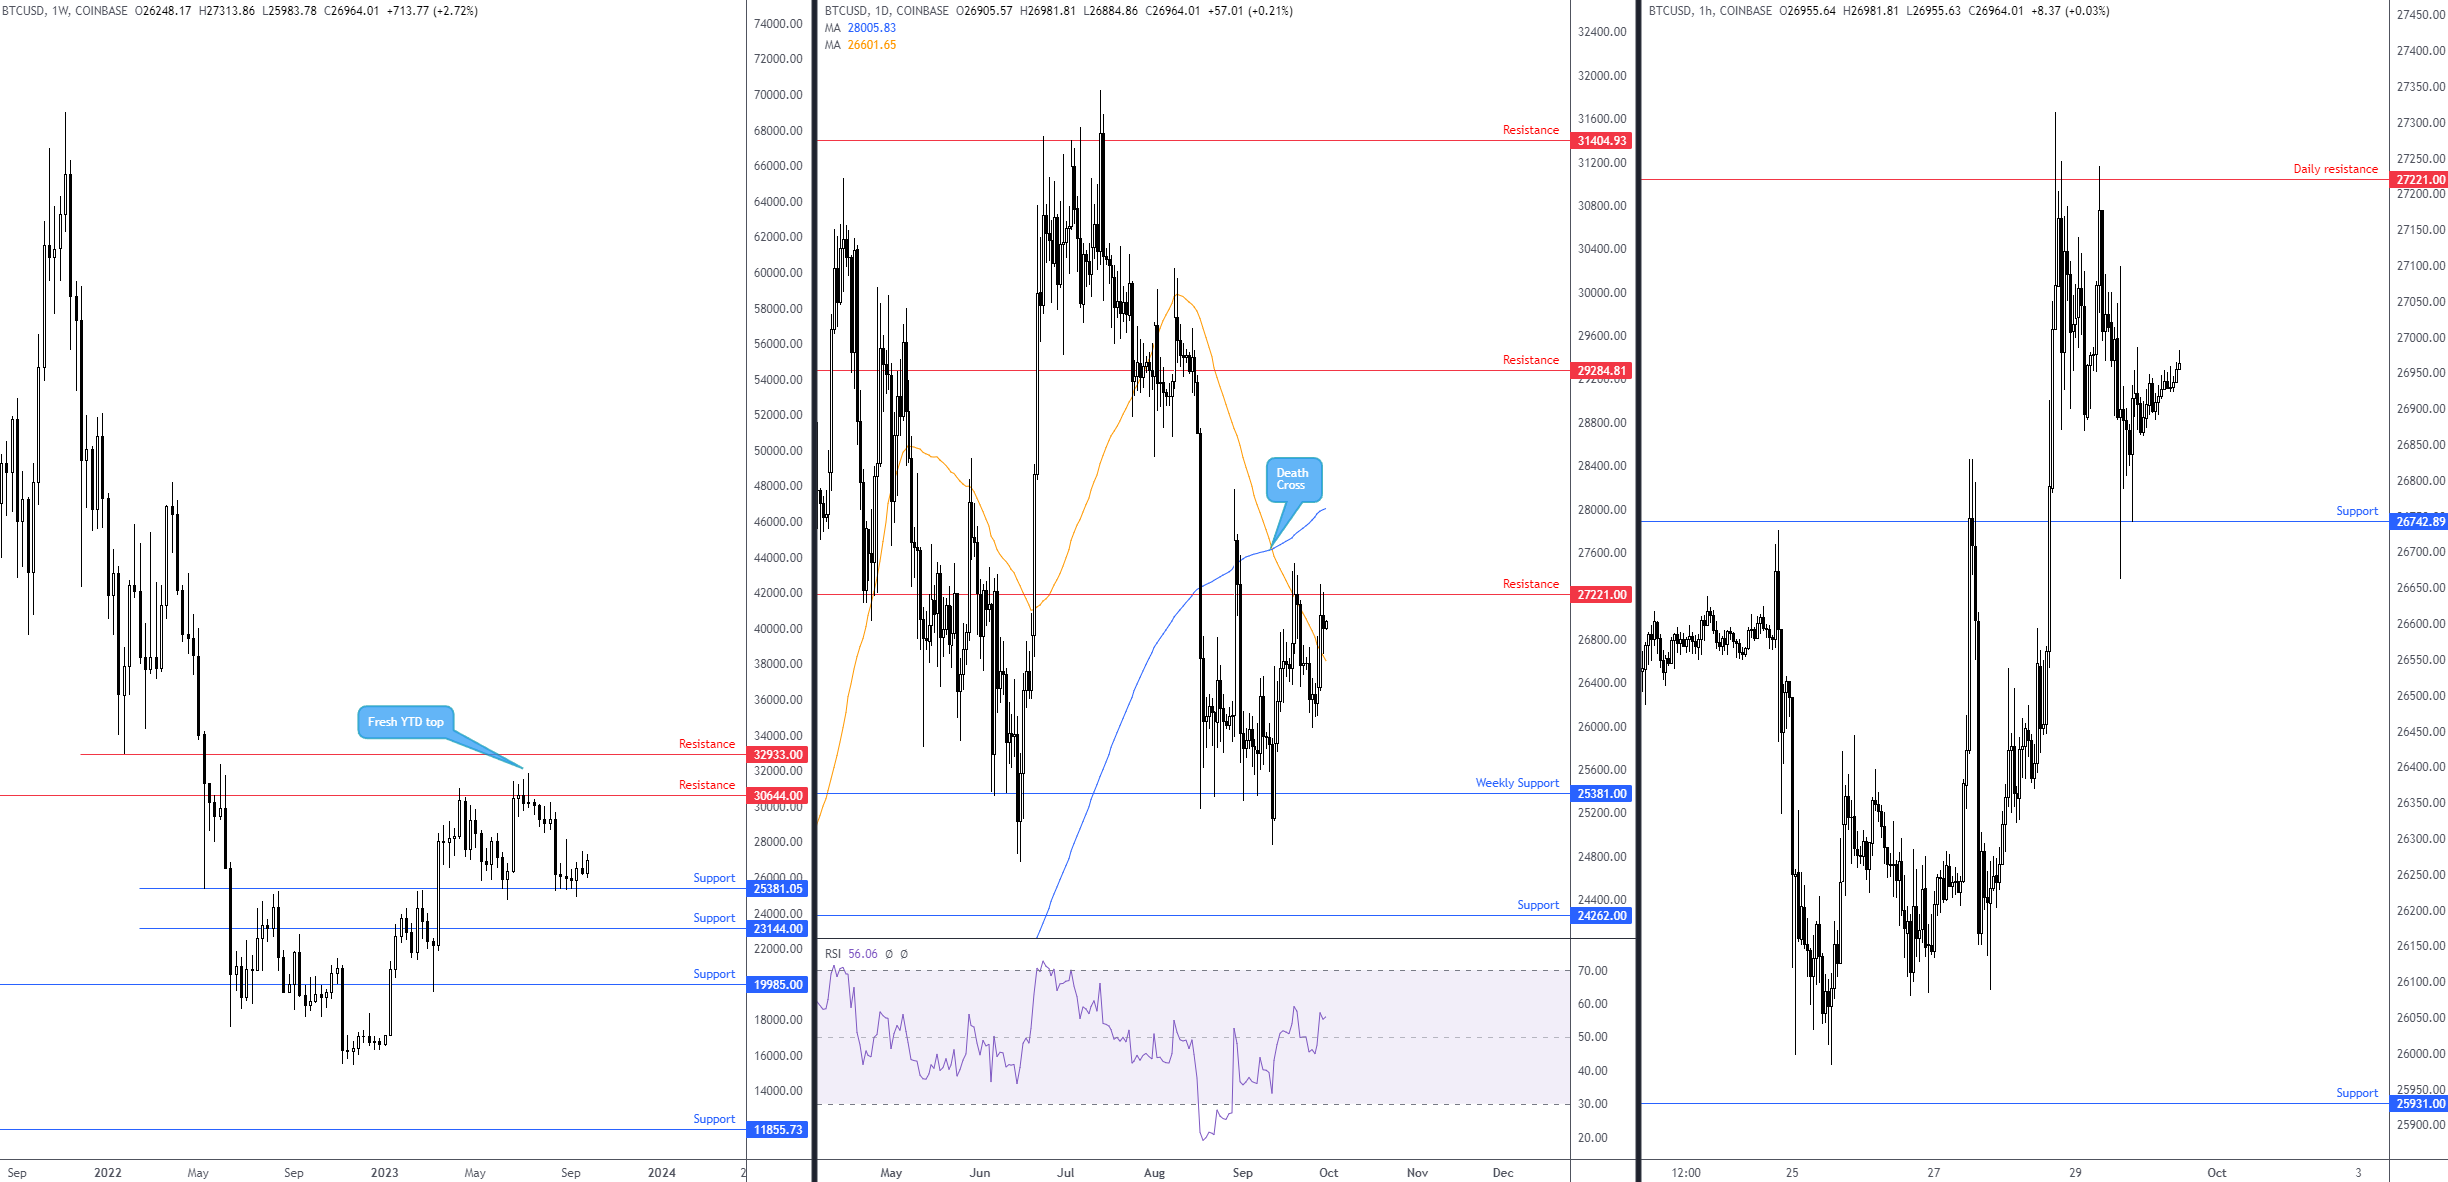
BTC/USD: Support holding firm
Weekly support at $25,381 has been a level of interest for the Research Team since price bumped heads with it in mid-August, following a rejection from weekly resistance overhead at $30,644. While rupturing this base unearths weekly support from $23,144, followed by another layer of support at $19,985, BTC/USD bulls went on the offensive last week, adding +2.6%. Adding to the possibility of further buying from here is the trend: we have been higher since bottoming in November at $15,460.
Meanwhile, price action on the daily timeframe reveals that the unit engulfed the 50-day simple moving average at $26,601 on Thursday and tested the mettle of a neighbouring resistance level at $27,221. Although a Death Cross emerged in September (that is, the 50-day simple moving average crossing below the 200-day simple moving average at $28,005, which suggests this market may be headed for a longer-term downward move), current resistance is an important base to watch this week. A break north of here would help add technical steam to the possibility of additional outperformance, which could lead to price overthrowing the 200-day simple moving average to target daily resistance at $29,284. For those who trade using the Relative Strength Index (RSI), you will also note that the indicator is now above its 50.00 centreline (positive momentum) A move south, however, places a bold question mark on weekly support highlighted above at $25,381.
On the H1 timeframe, buyers and sellers ended the week squaring off at support from $26,742, following a reaction from resistance on the daily timeframe at $27,221. Assuming the H1 support holds firm, this bodes well for those anticipating a breakout above daily resistance this week; conversely, this would place those short from daily resistance in a tricky situation and may see many reduce risk to breakeven in the event of further signs of bullish activity from the H1 support.
Ultimately, with weekly price rebounding from support at $25,381 in a market still trending north, along with daily price manoeuvring above the 50-day simple moving average at $26,601 (and retesting the level in the form of dynamic support on Friday) and H1 price holding at support from $26,742, chart studies suggest bulls have the edge this week and we could see the unit nudge beyond daily resistance at $27,221.
Charts: TradingView
This material on this website is intended for illustrative purposes and general information only. It does not constitute financial advice nor does it take into account your investment objectives, financial situation or particular needs. Commission, interest, platform fees, dividends, variation margin and other fees and charges may apply to financial products or services available from FP Markets. The information in this website has been prepared without taking into account your personal objectives, financial situation or needs. You should consider the information in light of your objectives, financial situation and needs before making any decision about whether to acquire or dispose of any financial product. Contracts for Difference (CFDs) are derivatives and can be risky; losses can exceed your initial payment and you must be able to meet all margin calls as soon as they are made. When trading CFDs you do not own or have any rights to the CFDs underlying assets.
FP Markets recommends that you seek independent advice from an appropriately qualified person before deciding to invest in or dispose of a derivative. A Product Disclosure Statement for each of the financial products is available from FP Markets can be obtained either from this website or on request from our offices and should be considered before entering into transactions with us. First Prudential Markets Pty Ltd (ABN 16 112 600 281, AFS Licence No. 286354).
Recommended Content
Editors’ Picks
EUR/USD stabilizes near 1.0500, looks to post weekly losses

EUR/USD extended its daily decline toward 1.0500 in the second half of the American session, pressured by the souring market mood. Despite the bullish action seen earlier in the week, the pair remains on track to register weekly losses.
GBP/USD falls below 1.2150 as USD rebounds

Following an earlier recovery attempt, GBP/USD turned south and declined below 1.2100 in the second half of the day on Friday. The negative shift seen in risk mood amid rising geopolitical tensions helps the US Dollar outperform its rivals and hurts the pair.
Gold advances to fresh multi-week highs above $1,920

Gold extended its daily rally and climbed above $1,920 for the first time in over two weeks on Friday. Escalating geopolitical tensions ahead of the weekend weigh on T-bond yields and provide a boost to XAU/USD, which remains on track to gain nearly 5% this week.
Bitcoin could be an alternative to US-listed companies but not in the short term

Bitcoin has dipped below $27,000, adding to the subdued cryptocurrency market sentiment. While short-term price concerns persist, analysts predict a rebound based on historical figures.
Nvidia Stock Forecast: NVDA slips as Biden administration attempts to close AI chip loophole

Nvida's stock price opened marginally lower on Friday after Reuters reported that the Biden administration is attempting to close a loophole that allowed Chinese companies access to state-of-the-art computer chips used for AI.