It was all about the US employment report on Friday. According to the Bureau of Labour Statistics (BLS), the headline non-farm payroll release was higher than expected at 187,000 in August (170,000 market consensus); this marked the third month the NFP number came in sub-200,000. The release noted that employment continued to trend in health care, leisure and hospitality, social assistance and construction, while employment in transportation and warehousing declined.
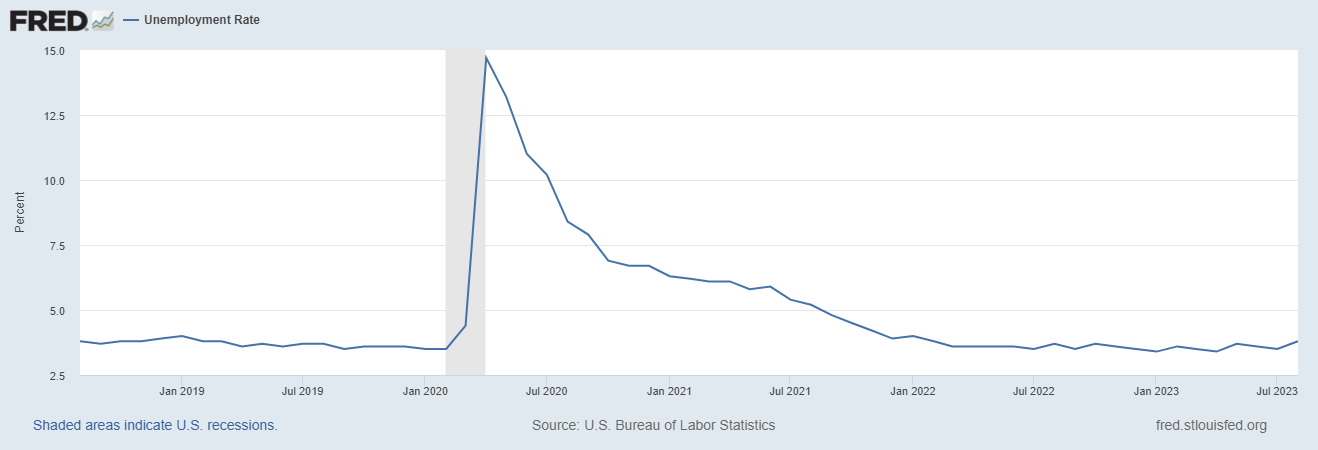
The US unemployment rate surprised markets, however, jumping to 3.8% (its highest level since January 2022), up from the 3.5% expected, adding strength behind a possible goldilocks theme (meaning the economy is not thrown into recession and inflation remains stable). On a MoM and YoY basis, wage growth also moderately slowed. From July to August, wages grew 0.2% (0.3% expected [0.4% previous]), marking the smallest increase since early 2022, and increased 4.3% in the twelve months to August (4.4% expected [4.4% previous]).
The aftermath of the release sent US yields lower along with the US Dollar Index to a session low of 103.27 and lifted US equity futures north as traders and investors cheered hopes that the Fed’s hiking regime could end. However, optimism was short-lived in the markets as US equity benchmarks eventually pared gains, and the US dollar and US yields caught a bid. Largely, this was a weaker jobs report. More Americans are unemployed, and those in employment are earning less, thus potentially affecting economic growth and consumer spending.
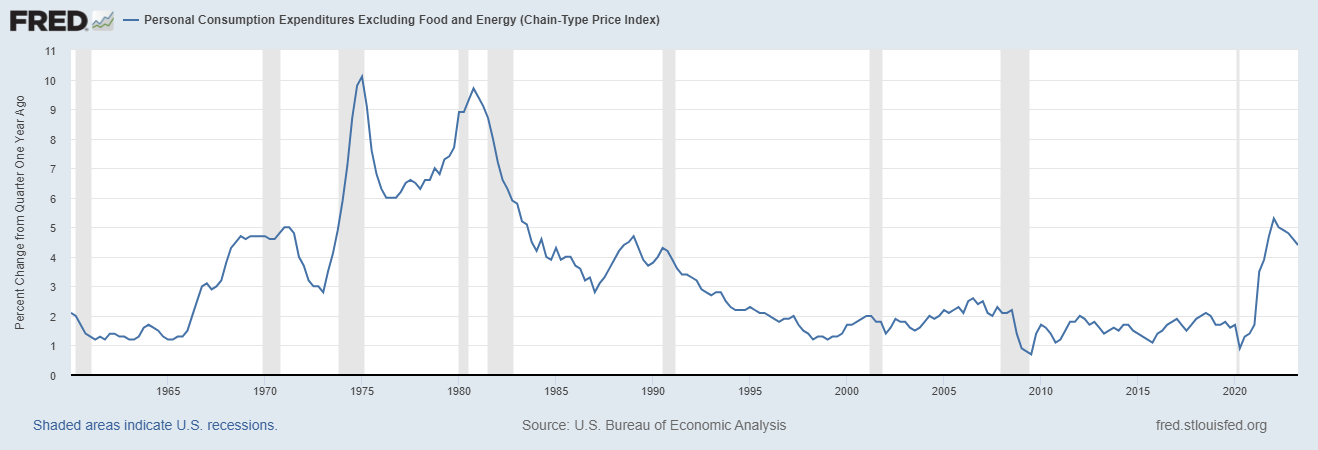
We also had the release of the Personal Consumption Expenditures (PCE) price index earlier last week—a broader measure than the CPI release and the preferred measure for the Fed—which ticked higher in July, as expected. According to the release from the Bureau of Economic Analysis (BEA), the headline PCE price index rose 3.3% in the twelve months to July, up from 3.0% in June; the core PCE price index for the same period, excluding food and energy, rose 4.2%, up from 4.1% in June. MoM, both headline PCE and core PCE releases came in at 0.2% and aligned with market consensus.
On balance, the PCE data was not too hot or cold; a minor increase was expected, and the overall trend in the core PCE is southbound for now. Therefore, this, along with cooler jobs data on Friday, reinforces the chances of the Fed holding rates at this month’s Fed meeting, with the probability about even for a hold/rate increase at November’s meeting as per the rates markets.
This week…
Monday will likely be a quiet one across the financial markets as US banks remain closed in observance of Labour Day. The Reserve Bank of Australia (RBA) and the Bank of Canada (BoC) are then in the spotlight in the first half of the week, expected to stand pat on rates at 4.1% and 5.0%, respectively. At the time of writing, markets have fully priced in a pause for the RBA, with a similar outlook for the BoC, which could weigh on the AUD and CAD this week. YTD, AUD/USD is down -5.4%, while the USD/CAD is marginally higher. With the BoC raising rates more than 400bps since it began policy firming, and growth cooling and the unemployment rate ticking higher to 5.5% in July, it is unlikely to move rates this month.
Over in the US, we have a relatively light economic calendar for the week. The US ISM services index will be a key watch and serve as the highlight out of the US, expected to tick lower to 52.5 versus the 52.7 print in July. It is unlikely that the ISM services data alters the market’s view regarding the September meeting. Prior to this event, you will note that the US S&P Global PMIs were softer than expected in August (released on 23 August). Manufacturing remained in contractionary territory at 47.0, down from 49.0 in July, and marks a fourth consecutive month of contraction. Over on the service side, activity cooled to its slowest since the beginning of this year to 51.0, down from a downwardly revised 52.3 in July. Friday’s data also saw the latest ISM manufacturing print, which contracted for a tenth consecutive month (< 50.00). Manufacturing data did, however, increase more than expected in the month of August at 47.6 (47.0 expected [46.4 previous]), but, of course, remains below that 50.00 threshold.
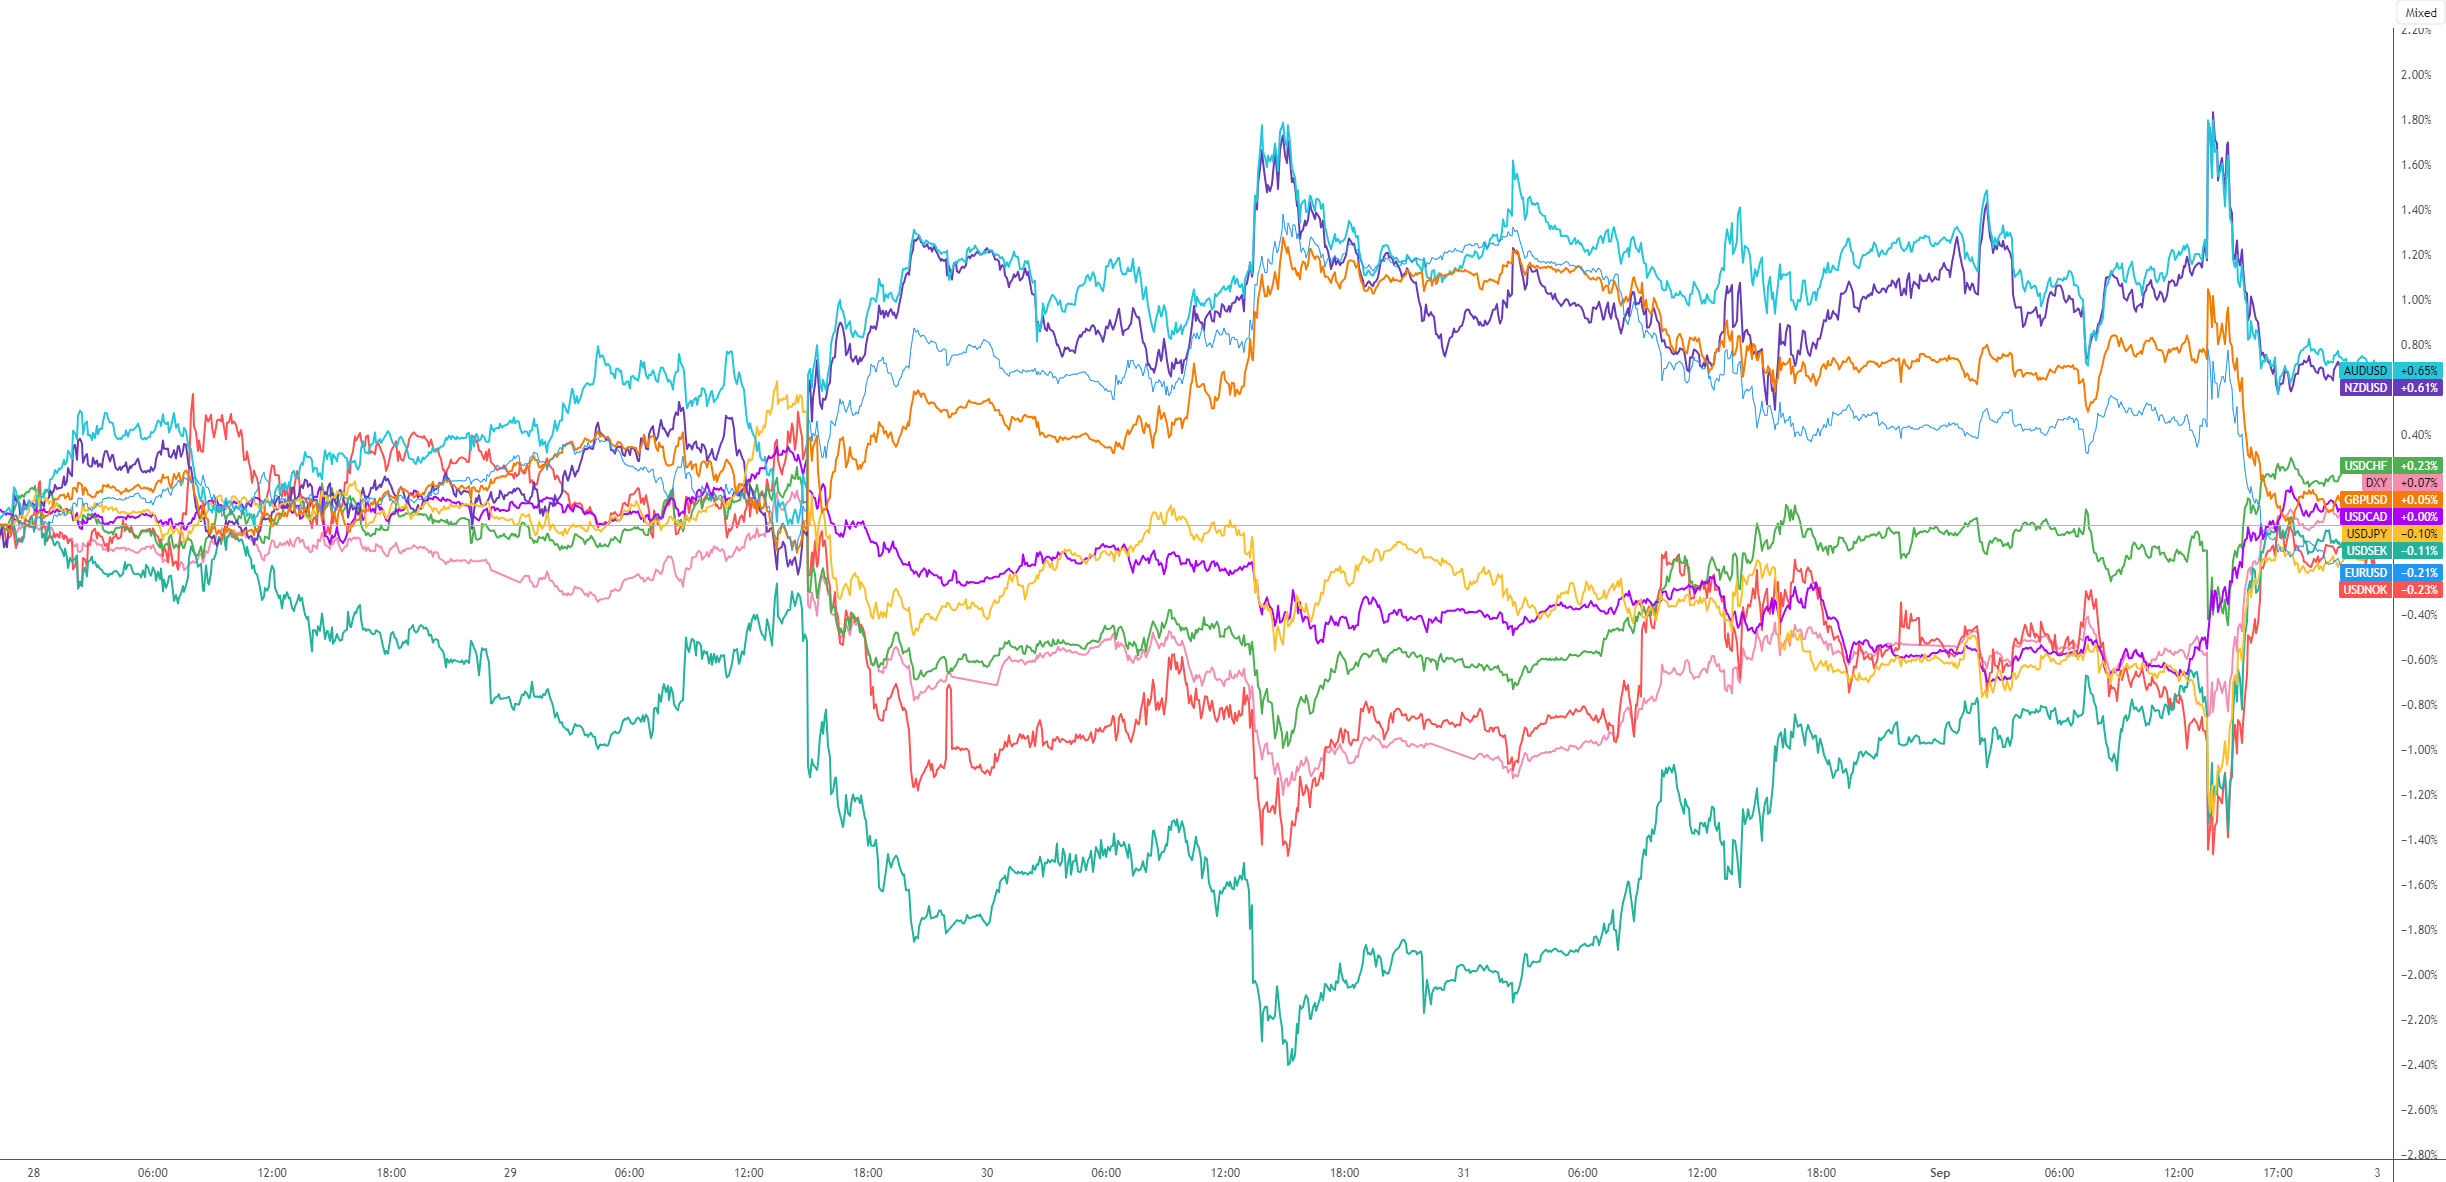
G10 FX (5-Day Change):
Technical perspective: Key markets
Dollar bulls: Gas left in the tank?
According to the US Dollar Index, the USD finished last week with a modest gain (+0.1%) and recorded its seventh week in positive terrain. MTD, the Dollar index also concluded +1.7% in the green and snapped a two-month losing streak.
For those who follow my Weekly Market Insights on a regular basis, you will recall that I highlighted the clear long-term uptrend present on the monthly timeframe and the recent rebound from monthly support. I noted the following in previous writing (italics):
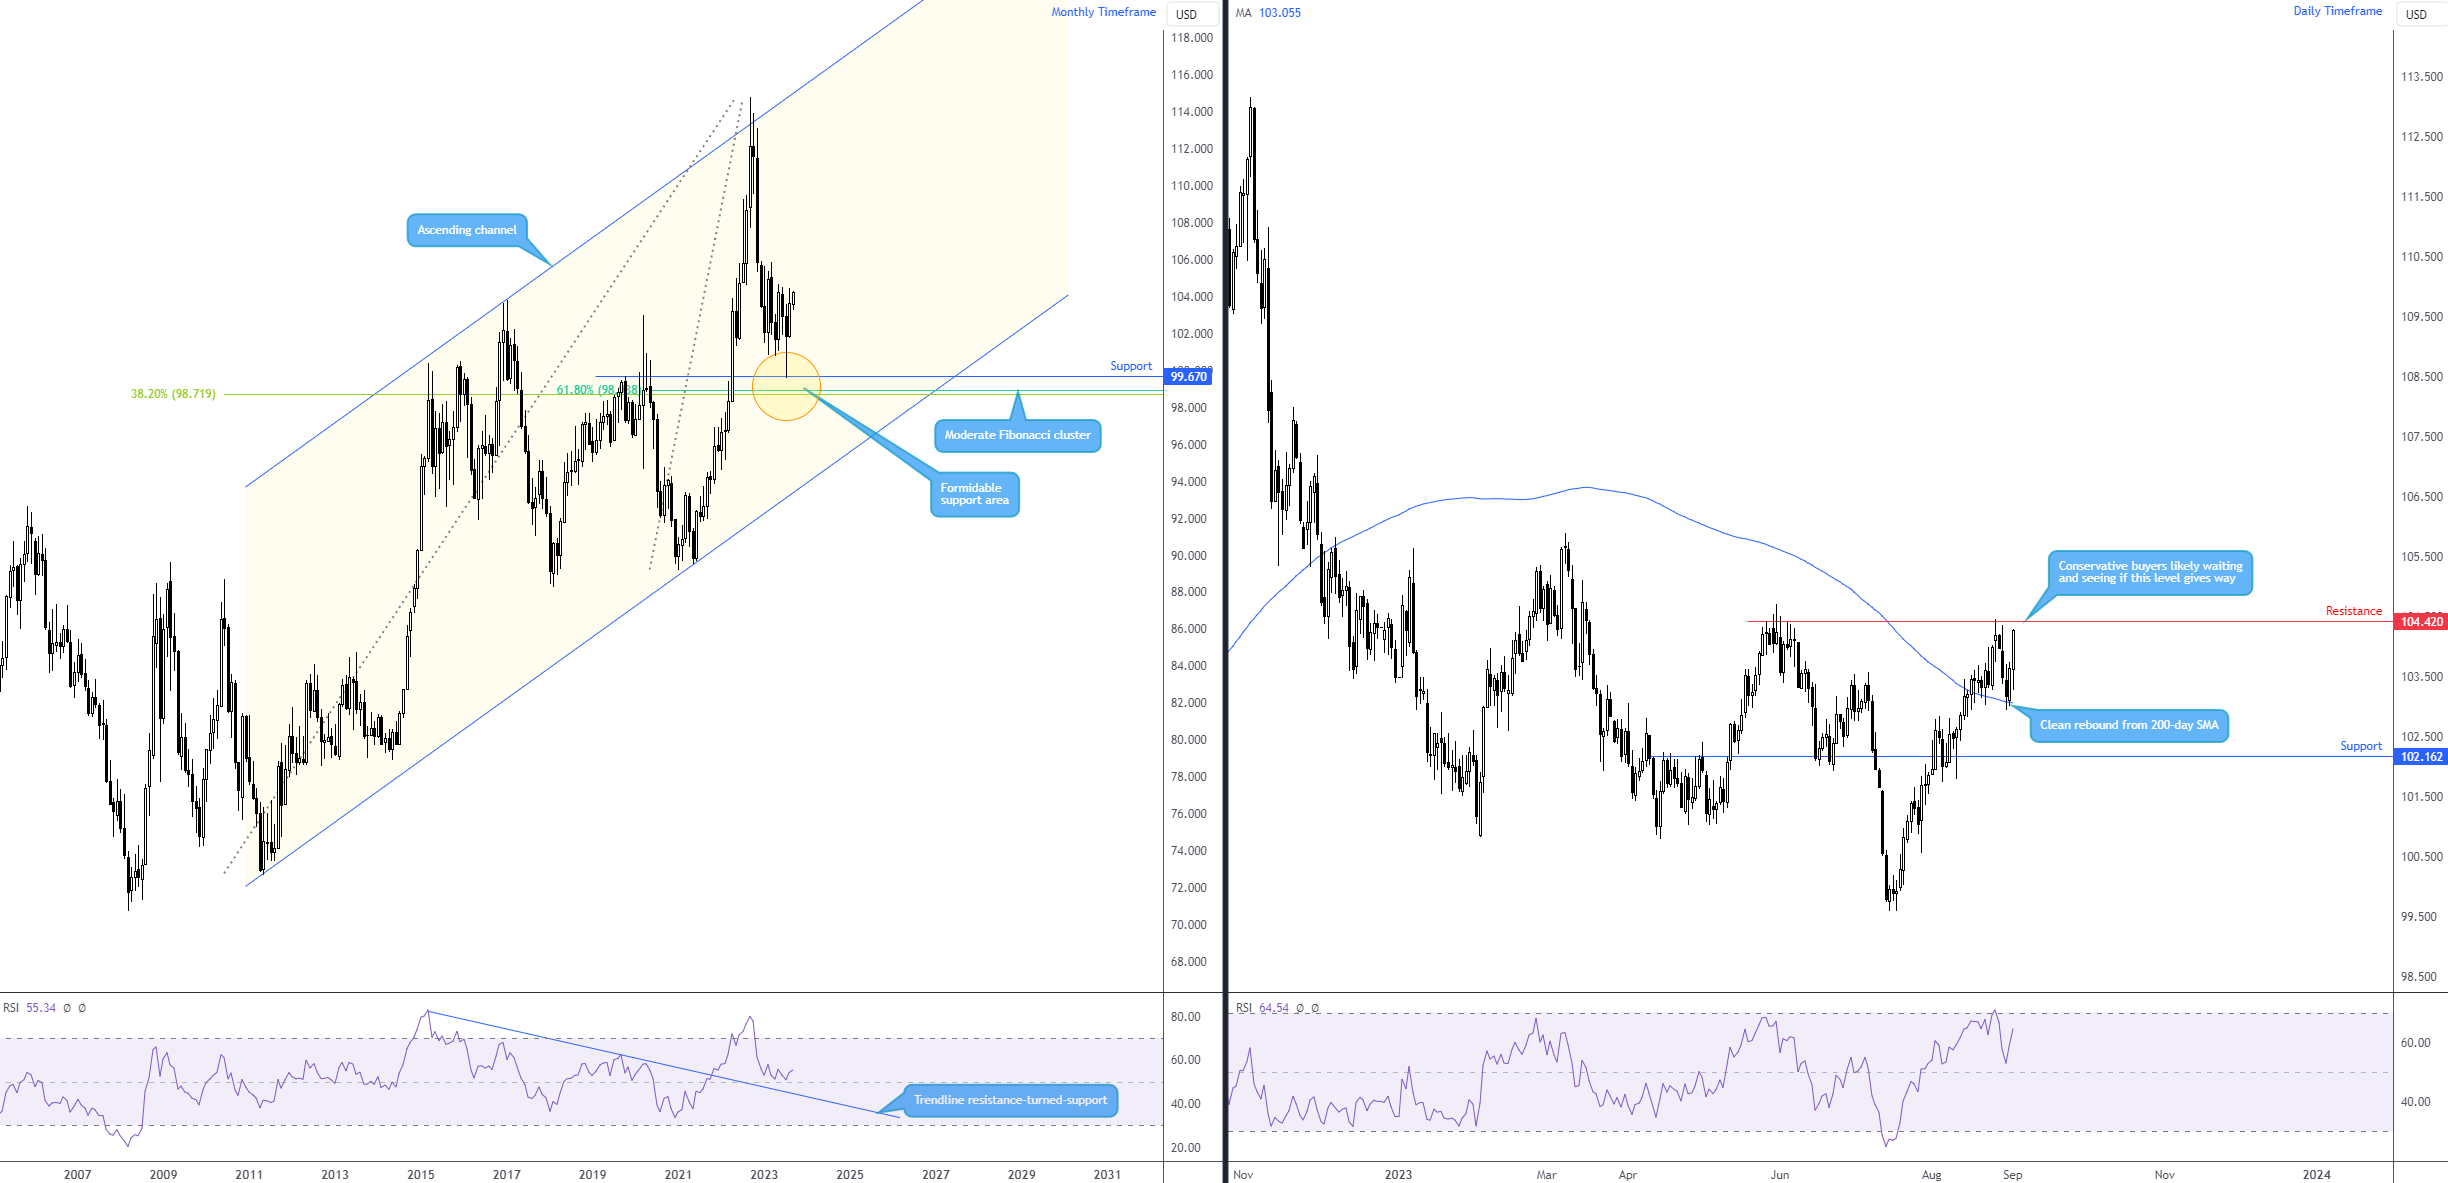
The long-term trend has been northbound since bottoming in 2008 at 70.70 if one focusses on the longer-term swings. Q4 (2022), as you can see, printed its latest correction from 114.78 (from channel resistance). Price action also recoiled from a substantial support level on the monthly timeframe at 99.67 in July (complemented by two neighbouring Fibonacci ratios [38.2% and 61.8%] at 98.72 and 98.95, respectively). This, of course, adds weight to the bullish offensive we have been seeing in recent weeks and is in harmony with the overall trend.
The monthly picture, therefore, remains dollar-positive in the long term.
On the daily timeframe, Thursday wrapped up in the shape of a bullish engulfing candle (these formations focus only on the candle’s real body and NOT the upper and lower shadows) and clipped a portion of the three-day decline earlier in the week. What’s interesting from a technical perspective is that Thursday’s rebound formed from the 200-day simple moving average at 103.06, with Friday’s follow-through move (+0.6%) landing price on the doorstep of resistance at 104.42.
Any corrections within the pullback starting from 18 July (99.59 low) have been few and far between on the daily timeframe (note that we have been trending lower on the daily since Q4 2022 [the correction on the monthly scale]). This tells me there is some strength behind the recent USD offensive, at least in the medium term. The latest correction last week (from daily resistance at 104.42), however, will be a test for USD bulls. Should the index maintain its position above the 200-day SMA this week and eventually dethrone daily resistance at 104.42, this would likely prompt additional longs to enter the market, in line with the longer-term uptrend and recent bounce from monthly support (see above).
S&P 500 snaps five-month winning streak
The S&P 500 finished -1.8% lower in August, trimming a share of the previous five-month bullish phase.
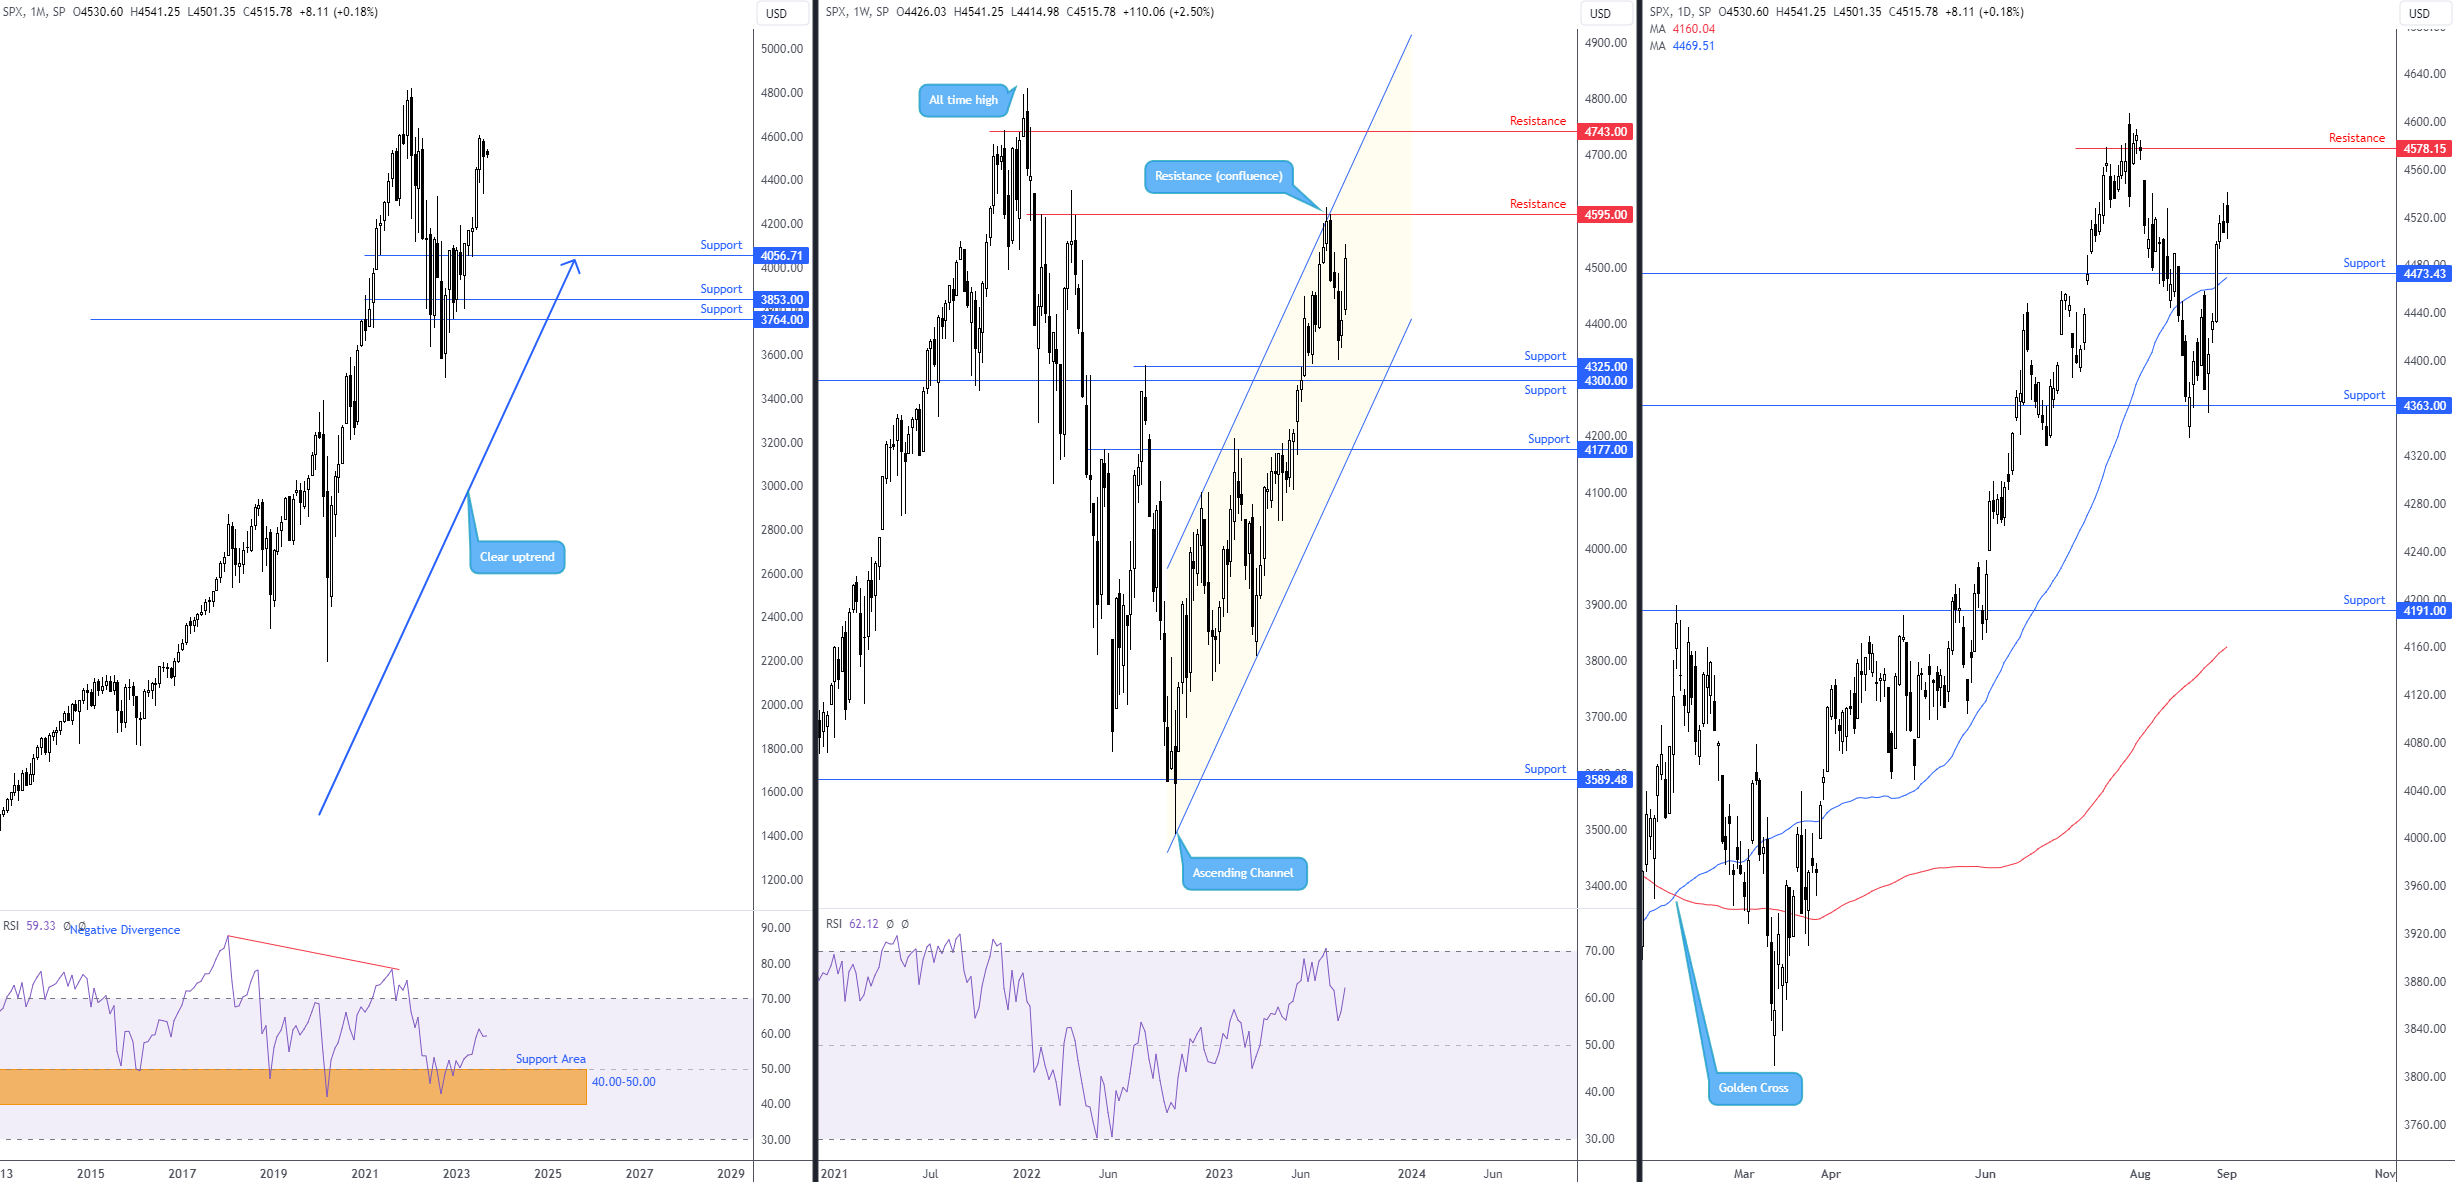
As evident from the monthly timeframe, though, while the US equity index did indeed settle lower, it ended considerably off worst levels and closed near the upper end of the prior month’s range. As a result, technically speaking, buyers remain in the driving seat. The all-time high at 4,818 (set at the beginning of 2022) remains a logical target on the monthly scale, in a market trending higher since early 2009 (aided by the Relative Strength Index [RSI] rebounding from support between 40.00 and 50.00).
Stepping down to the weekly timeframe, the unit came within a stone’s throw of a support area between 4,300 and 4,325 that I highlighted in previous work, before staging a solid rebound in the second half of August. Resistance at 4,595 will likely be on the radar for many traders and investors this week, considering the ceiling it delivered at the end of July. Though having seen limited resistance on the monthly chart, a breakout north of 4,595 could be on the table in the coming weeks, a move unearthing another weekly resistance at 4,743, sheltered just under the all-time high noted above.
Sliding across to the daily chart, we can see that last week manoeuvred above the 50-day simple moving average at 4,469 and resistance priced at 4,473 (now marked as support). With last week shaking out any remaining sellers at the aforementioned levels, the runway appears clear for an approach to resistance at 4,578 this week, which happens to reside south of the weekly resistance level at 4,595.
Apple (AAPL) rebounded from key support and recorded its largest one-week gain this year
Keeping things simple on AAPL this week:
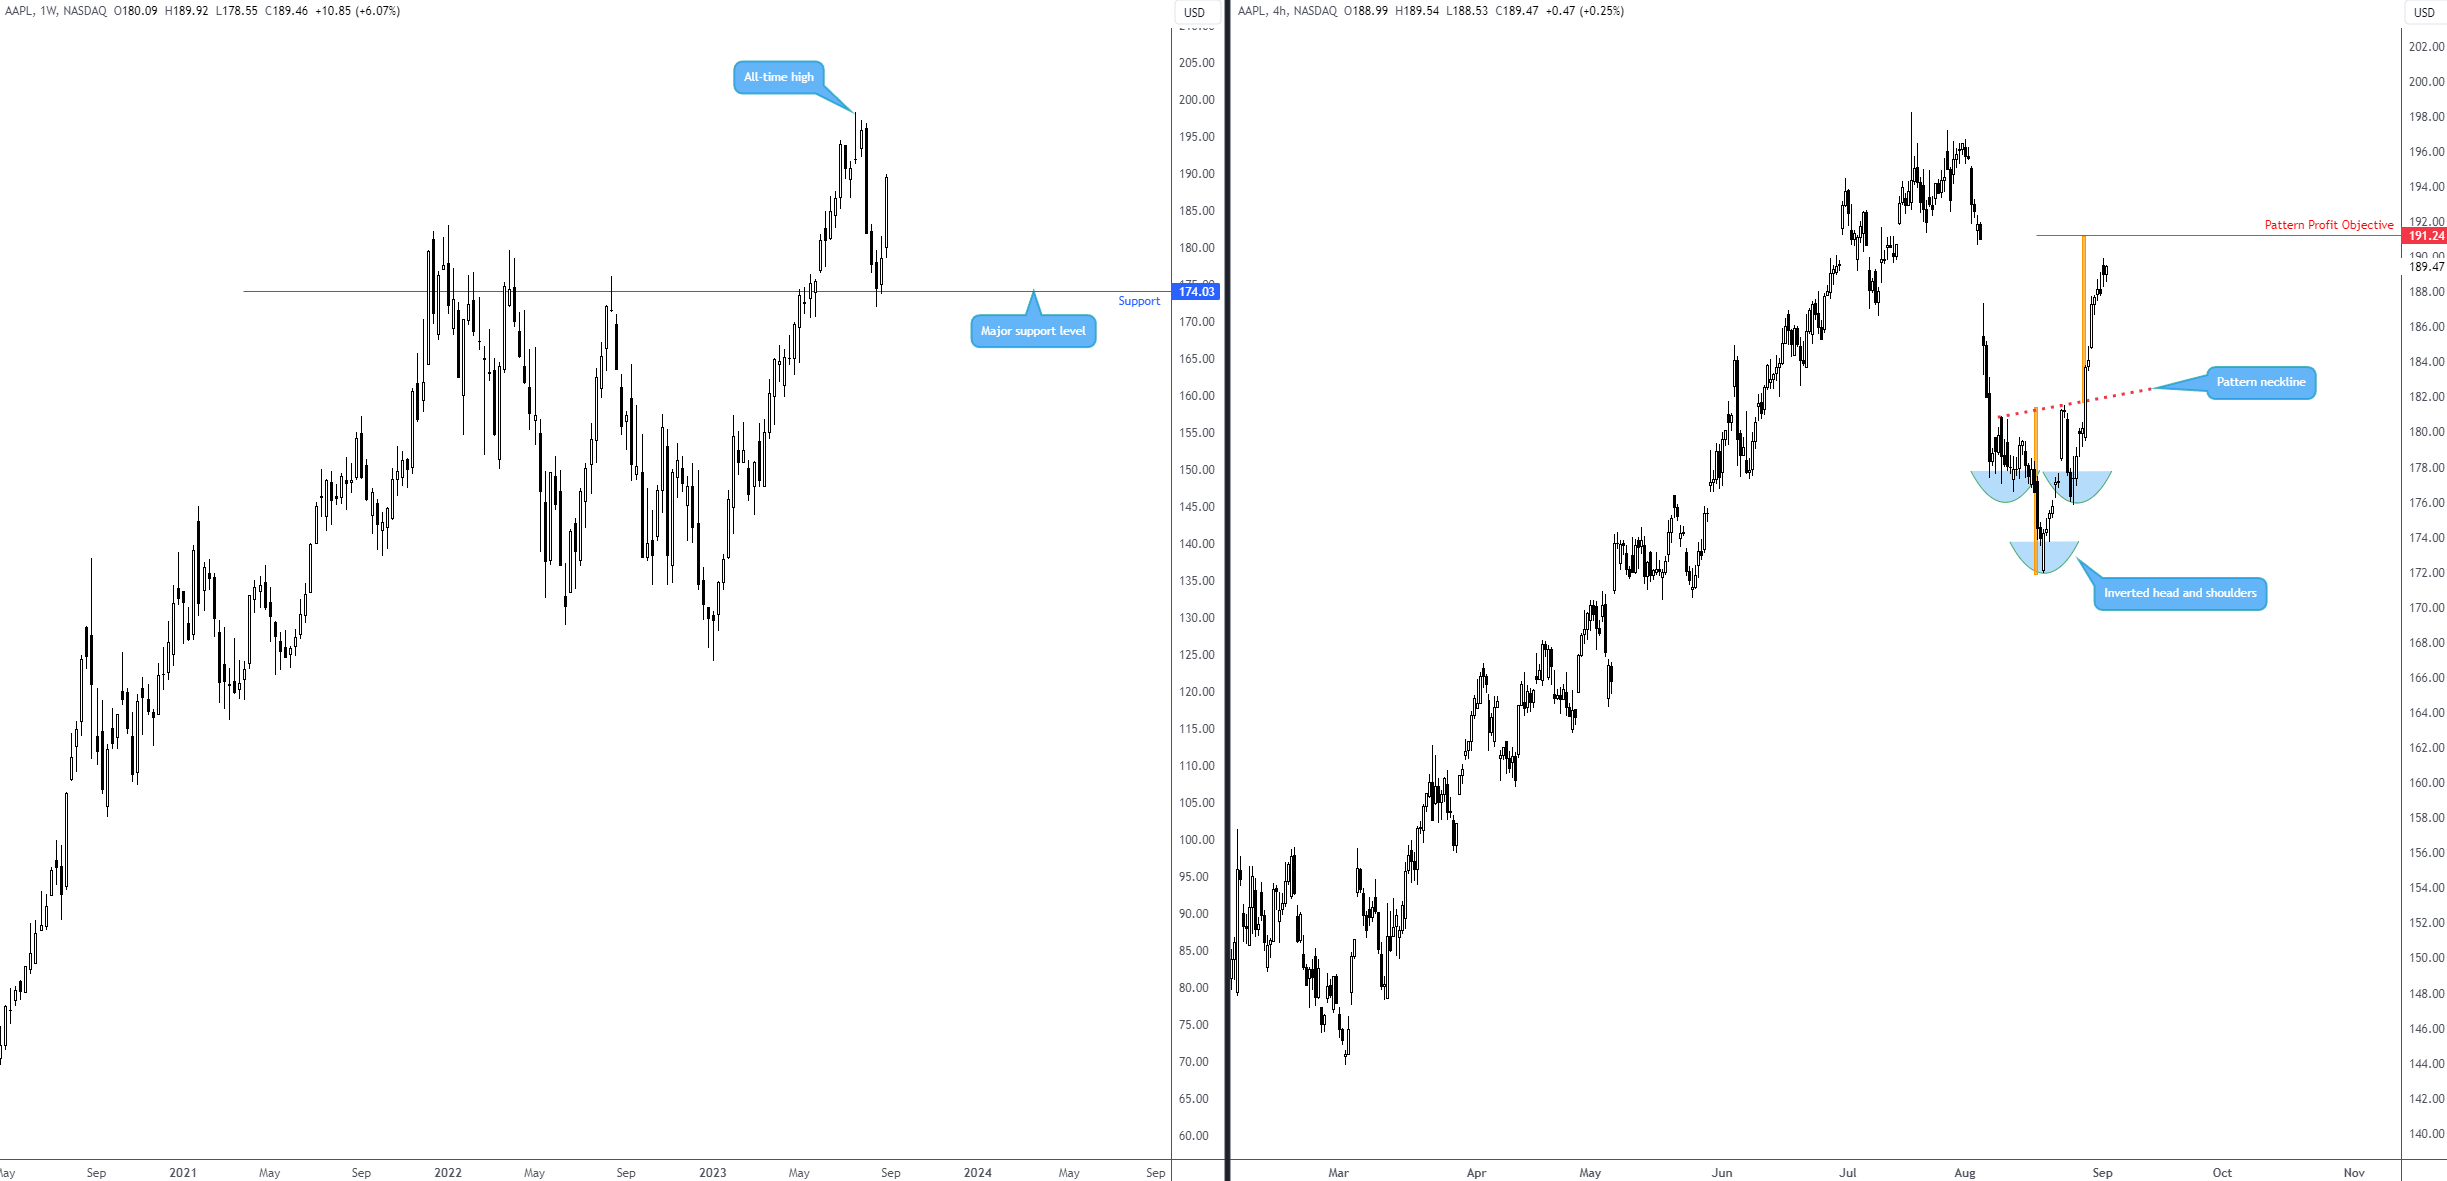
As seen from the weekly chart of AAPL, the price staged a notable rebound from key support at $174.03 in the second half of August. This move not only shone a light on the all-time high of $198.23 as a viable upside objective but it was also accompanied by a H4 inverted head and shoulders pattern ([left shoulder] $176.55 [head] $171.96 [right shoulder] $175.82).
Visible from the H4 chart, thanks to price clearing the pattern’s neckline taken from the high of 180.92, there is scope to climb until reaching the inverted H&S pattern profit objective at $191.24. This means further buying could be seen in early trading this week, with subsequent bullish flow north of $191.24 likely to welcome breakout buyers, targeting the all-time high of $198.23.
WTI oil rallies +7.5%, recording its largest one-week gain since Q1 2023 and refreshing ytd peaks
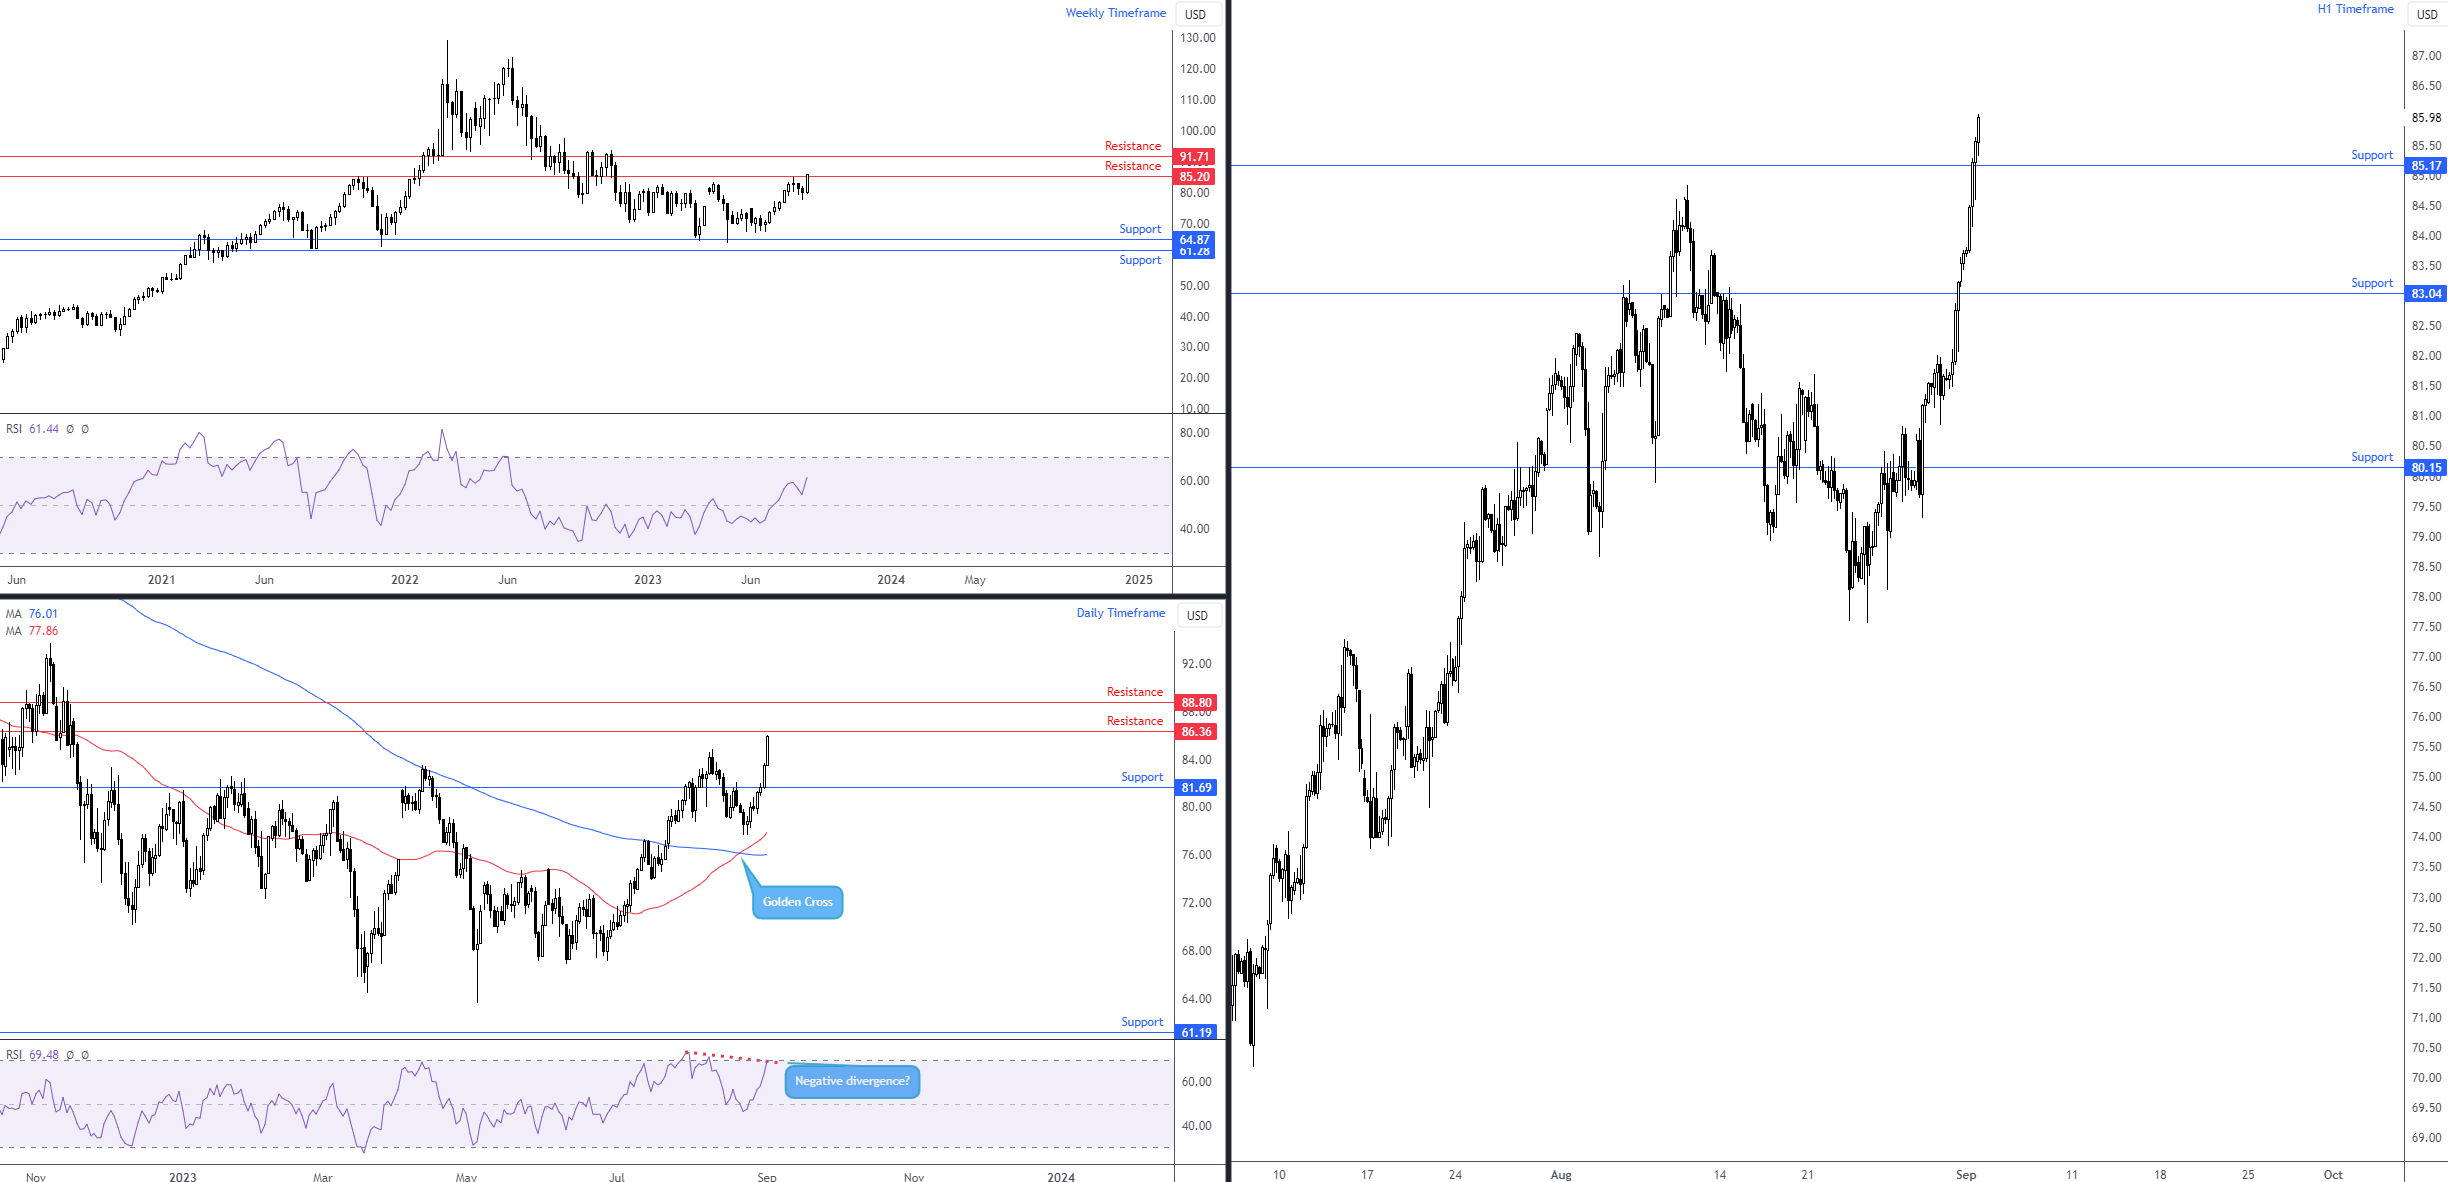
Out of the last ten weeks of trading, WTI oil has only printed losses in two of those weeks. Suffice it to say, considering last week’s +7.5% gain, bulls remain firmly on the offensive for now. However, although further upside is supported by the Relative Strength Index exploring higher levels north of the 50.00 centreline on the weekly timeframe (positive momentum), resistance on the weekly chart at $85.20 serves as a potential technical headwind this week (despite a minor close above the level). Consequently, $85.20 will be key to monitor going forward; stripping offers from the aforesaid base reveals $91.71 resistance as a possible upside target on the weekly chart and potentially hands the baton to breakout buyers.
Elsewhere, on the daily timeframe, Friday closed out the week +2.9% higher and recorded a fourth consecutive daily gain. Underpinning the possibility of further strength in this market on this timeframe is the formation of a Golden Cross, which occurred in late August (the 50-day simple moving average [$77.86] crossing above the 200-day simple moving average [$76.01] and is generally observed as a signal that the market could be headed for a longer-term uptrend). On the flip side of this, however, the daily chart’s RSI reveals the possibility of negative divergence (essentially informing traders and investors that upside momentum might be slowing and thus giving rise to a pause or even a reversal). Regarding technical structure to keep an eye on this week, resistance calls for attention nearby at $86.36, sheltered by another neighbouring layer of resistance coming in at $88.80, while support demands consideration at $81.69. Evidently, the combination of weekly resistance at $85.20, daily resistance from $86.36 and daily RSI negative divergence may prove troublesome for bulls this week.
Across the page on the H1 chart, I see price made its way above resistance at $85.17 on Friday, which I have now marked as a potential support base. Although short-term players may interpret this as a breakout higher, given we’re now at fresh YTD highs, the weekly and daily resistances (see above) could hamper upside. Overall, until daily resistance at $86.36 is challenged (and cleared), most breakout buyers are unlikely to be willing to pull the trigger based on the H1 resistance breach on Friday. Therefore, $86.36 will likely be key for some traders this week.
BTC/USD: Weekly support vulnerable; additional underperformance in the offing?
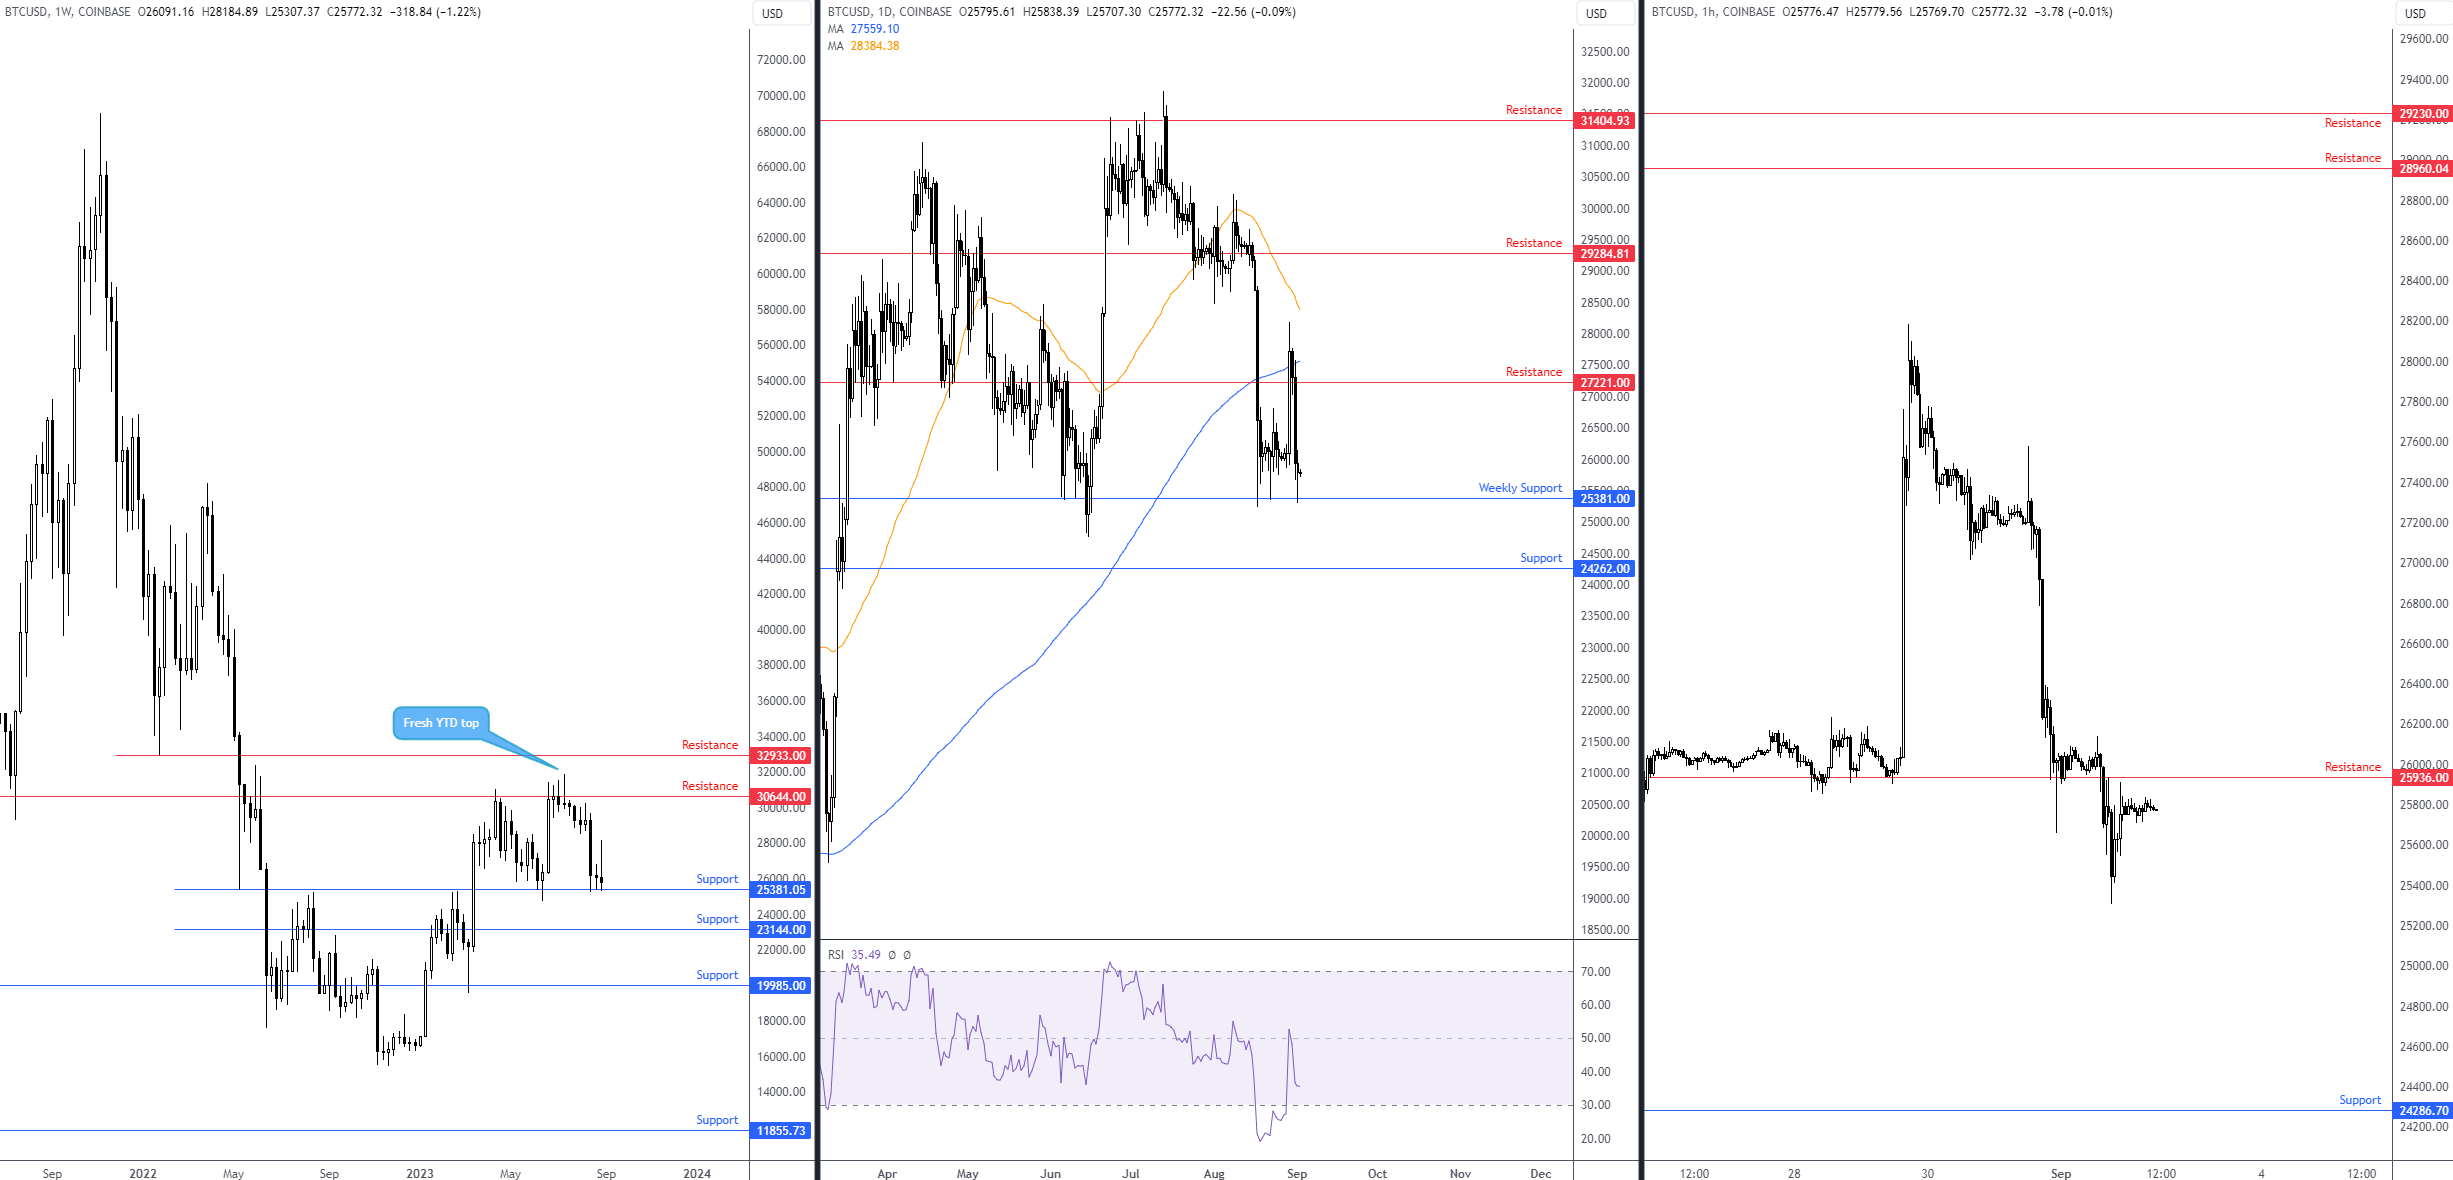
Against the US dollar, the price of Bitcoin wrapped up the week considerably off best levels, despite shaking hands with support on the weekly timeframe at $25,381 last week. The test of support, as I communicated in previous analysis, follows a rejection from weekly resistance overhead at $30,644. The key observation for me this week is the weekly support level at $25,381; rupturing this base unearths weekly support from $23,144, followed by another layer of support at $19,985. Technically speaking, the risk of further declines is possible above $25,381, considering the feeble buying so far. Assuming sellers do indeed make a push, this could also see the beginnings of an early trend reversal unfold if we nudge beneath the $24,750 low (the most recent higher low formed on 15 June).
You will note that on the daily timeframe, mid-week trading observed price connect with resistance at $27,221, a level accompanied by the widely watched 200-day simple moving average (often serving as dynamic support and resistance), currently at $27,559. The combination of this technical resistance was evidently sufficient for technical sellers to put in an appearance and cap buying off the weekly support highlighted above at $25,381. This—coupled with the Relative Strength Index (RSI) recoiling from the lower side of the 50.00 centreline (negative momentum)—places a bold question mark on the weekly support this week and throws light on daily support at $24,262.
As we move to the H1 timeframe, $25,936 is a key short-term level. You will note that the level was breached in recent trading, potentially signalling a willingness to retest the mettle of weekly support at $25,381 and opening the door for short-term breakout selling opportunities. Interestingly, I also see limited support on the H1 chart until as far south as $24,286, indicating that price could tunnel through $25,381 in the following weeks.
This material on this website is intended for illustrative purposes and general information only. It does not constitute financial advice nor does it take into account your investment objectives, financial situation or particular needs. Commission, interest, platform fees, dividends, variation margin and other fees and charges may apply to financial products or services available from FP Markets. The information in this website has been prepared without taking into account your personal objectives, financial situation or needs. You should consider the information in light of your objectives, financial situation and needs before making any decision about whether to acquire or dispose of any financial product. Contracts for Difference (CFDs) are derivatives and can be risky; losses can exceed your initial payment and you must be able to meet all margin calls as soon as they are made. When trading CFDs you do not own or have any rights to the CFDs underlying assets.
FP Markets recommends that you seek independent advice from an appropriately qualified person before deciding to invest in or dispose of a derivative. A Product Disclosure Statement for each of the financial products is available from FP Markets can be obtained either from this website or on request from our offices and should be considered before entering into transactions with us. First Prudential Markets Pty Ltd (ABN 16 112 600 281, AFS Licence No. 286354).
Recommended Content
Editors’ Picks
EUR/USD stabilizes near 1.0500, looks to post weekly losses

EUR/USD extended its daily decline toward 1.0500 in the second half of the American session, pressured by the souring market mood. Despite the bullish action seen earlier in the week, the pair remains on track to register weekly losses.
GBP/USD falls below 1.2150 as USD rebounds

Following an earlier recovery attempt, GBP/USD turned south and declined below 1.2100 in the second half of the day on Friday. The negative shift seen in risk mood amid rising geopolitical tensions helps the US Dollar outperform its rivals and hurts the pair.
Gold advances to fresh multi-week highs above $1,920

Gold extended its daily rally and climbed above $1,920 for the first time in over two weeks on Friday. Escalating geopolitical tensions ahead of the weekend weigh on T-bond yields and provide a boost to XAU/USD, which remains on track to gain nearly 5% this week.
Bitcoin could be an alternative to US-listed companies but not in the short term

Bitcoin has dipped below $27,000, adding to the subdued cryptocurrency market sentiment. While short-term price concerns persist, analysts predict a rebound based on historical figures.
Nvidia Stock Forecast: NVDA slips as Biden administration attempts to close AI chip loophole

Nvida's stock price opened marginally lower on Friday after Reuters reported that the Biden administration is attempting to close a loophole that allowed Chinese companies access to state-of-the-art computer chips used for AI.